
Response inspector
Read JSON and XML, inspect timings, and save binary responses.
The response pane shows what the endpoint returned. The toolbar displays the status, request duration, and body size.
Explore JSON
| View | Use it to |
|---|---|
| Tree | Expand nested objects or arrays and find a field or value. |
| Raw | Read the response source. Use the format action when you need indentation. |
| Map | Explore the structure and field types. |
| Table | Browse an array as rows. Filter, sort, and export the data as CSV. |
Send the request from Quick start and select Table. Each post becomes a row. Select a column heading to sort the rows, or use search to find a value.
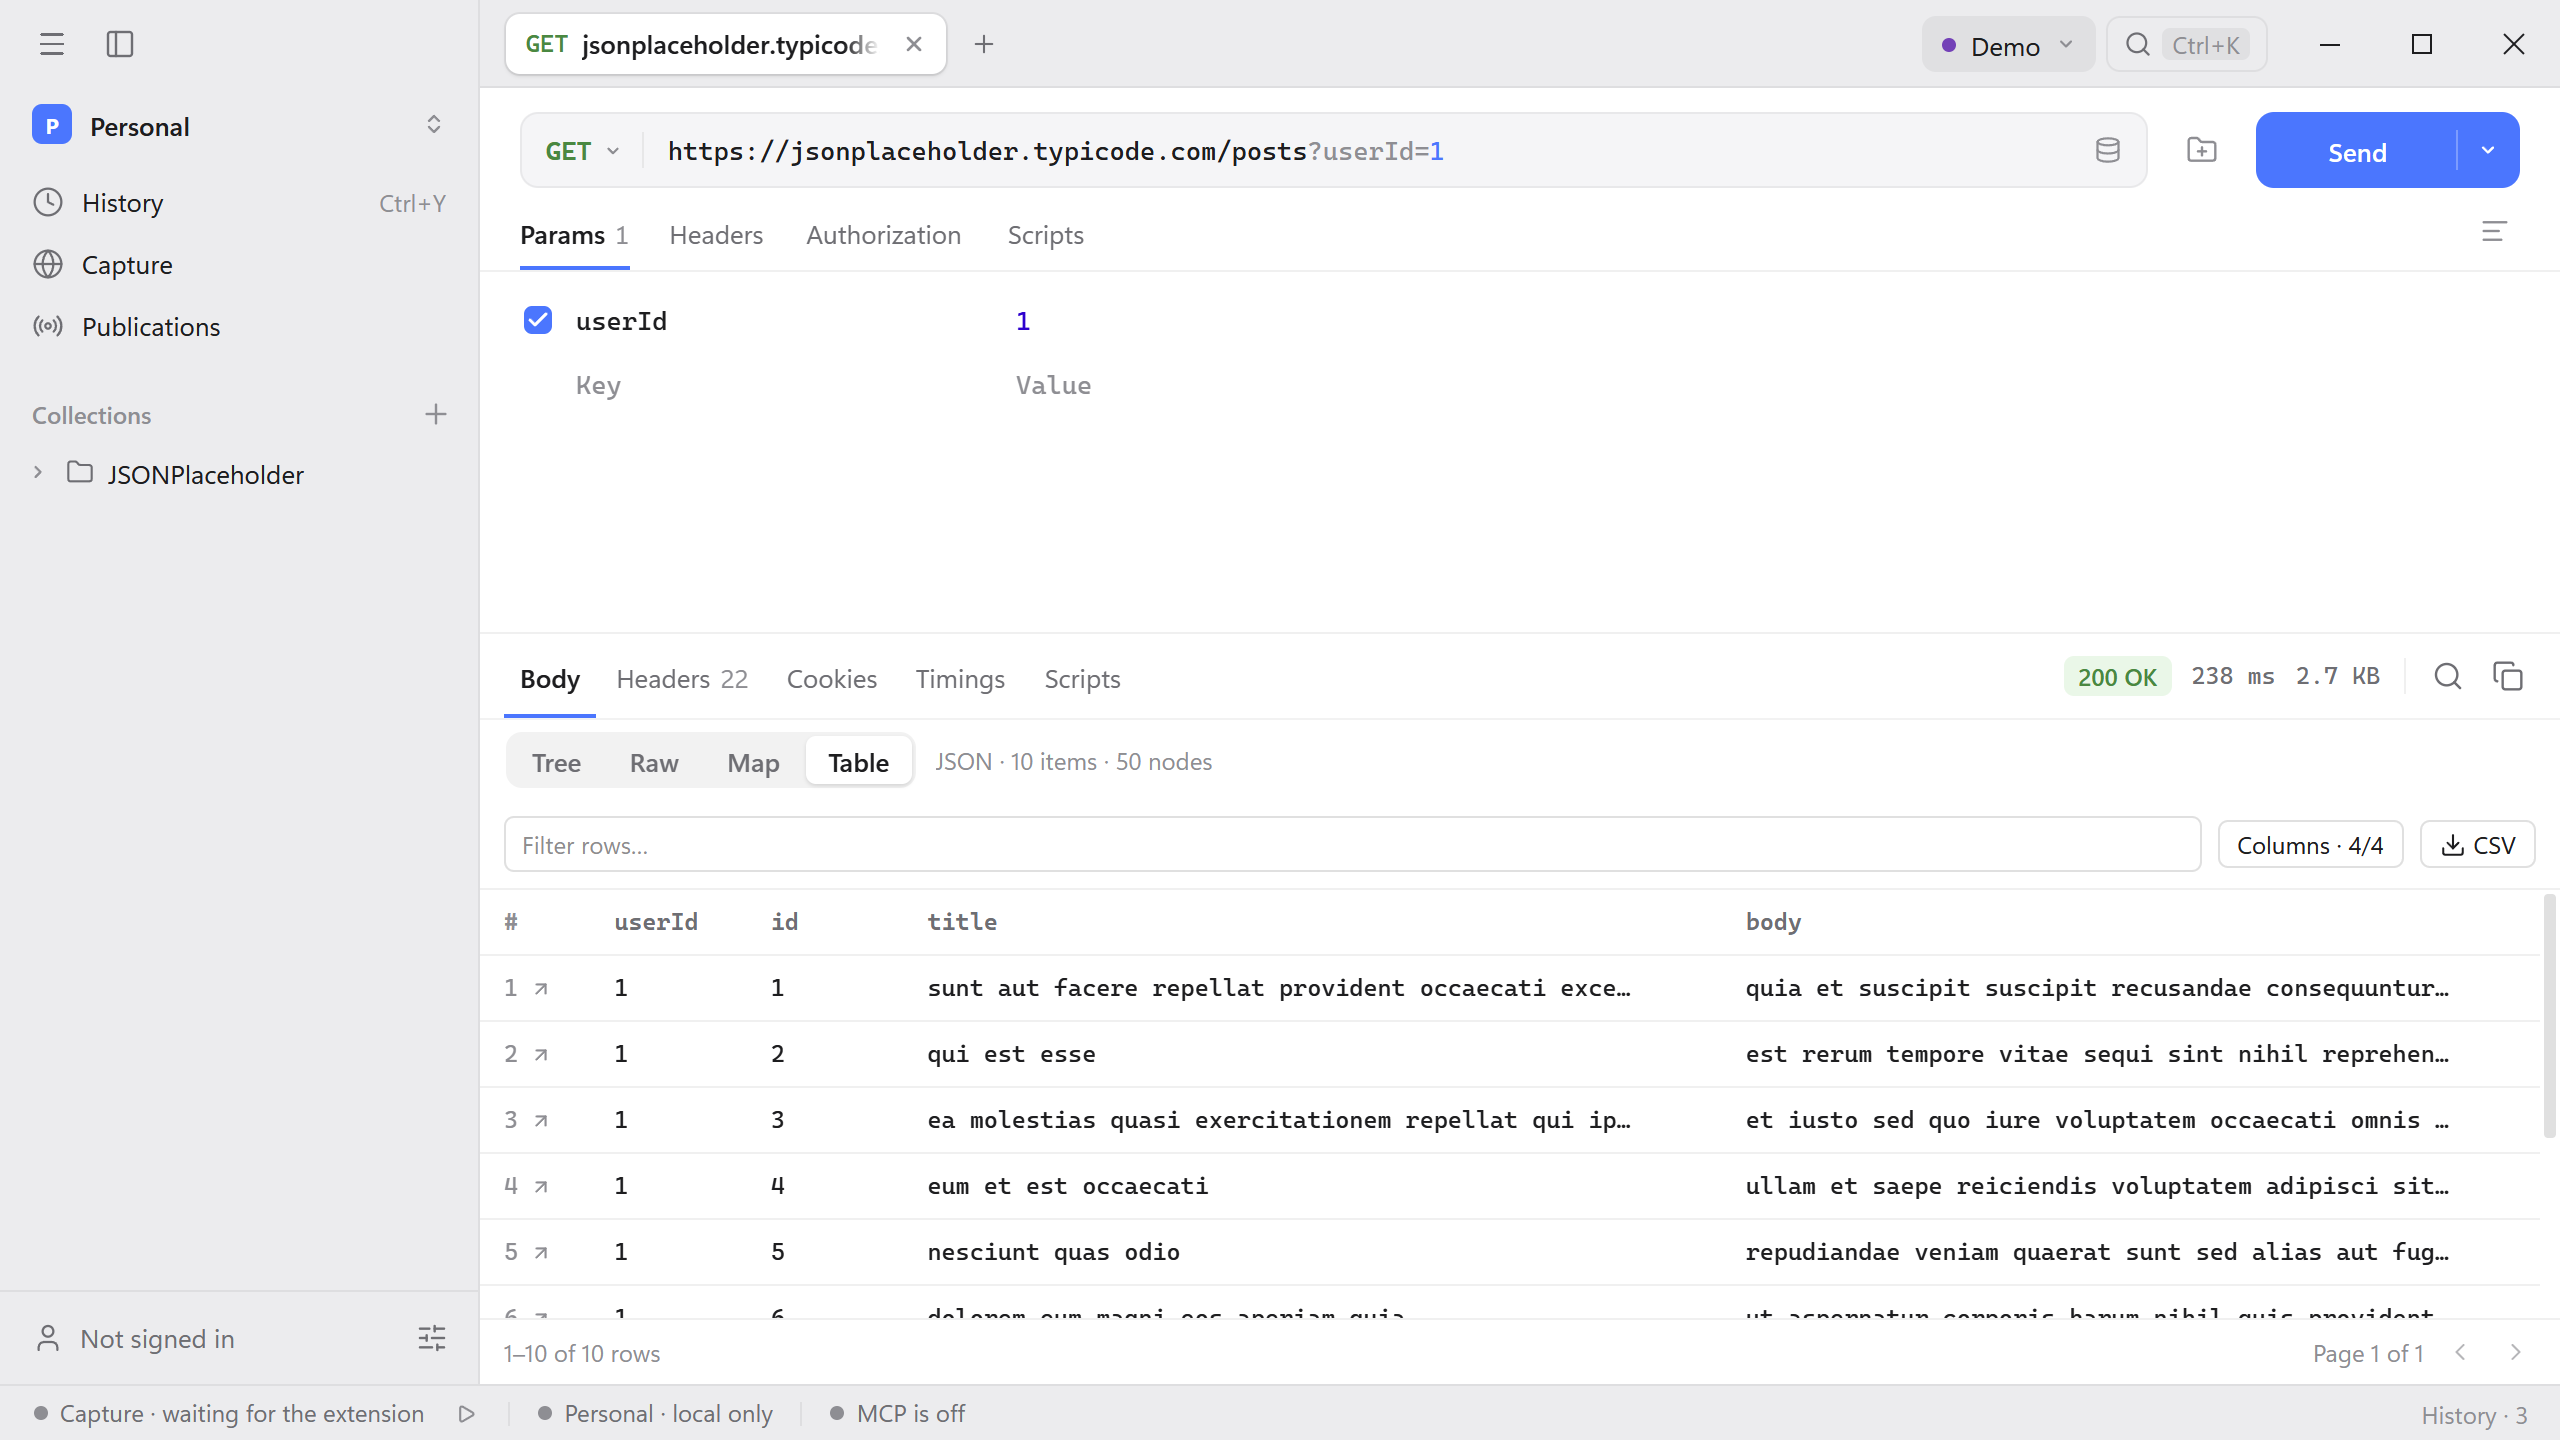
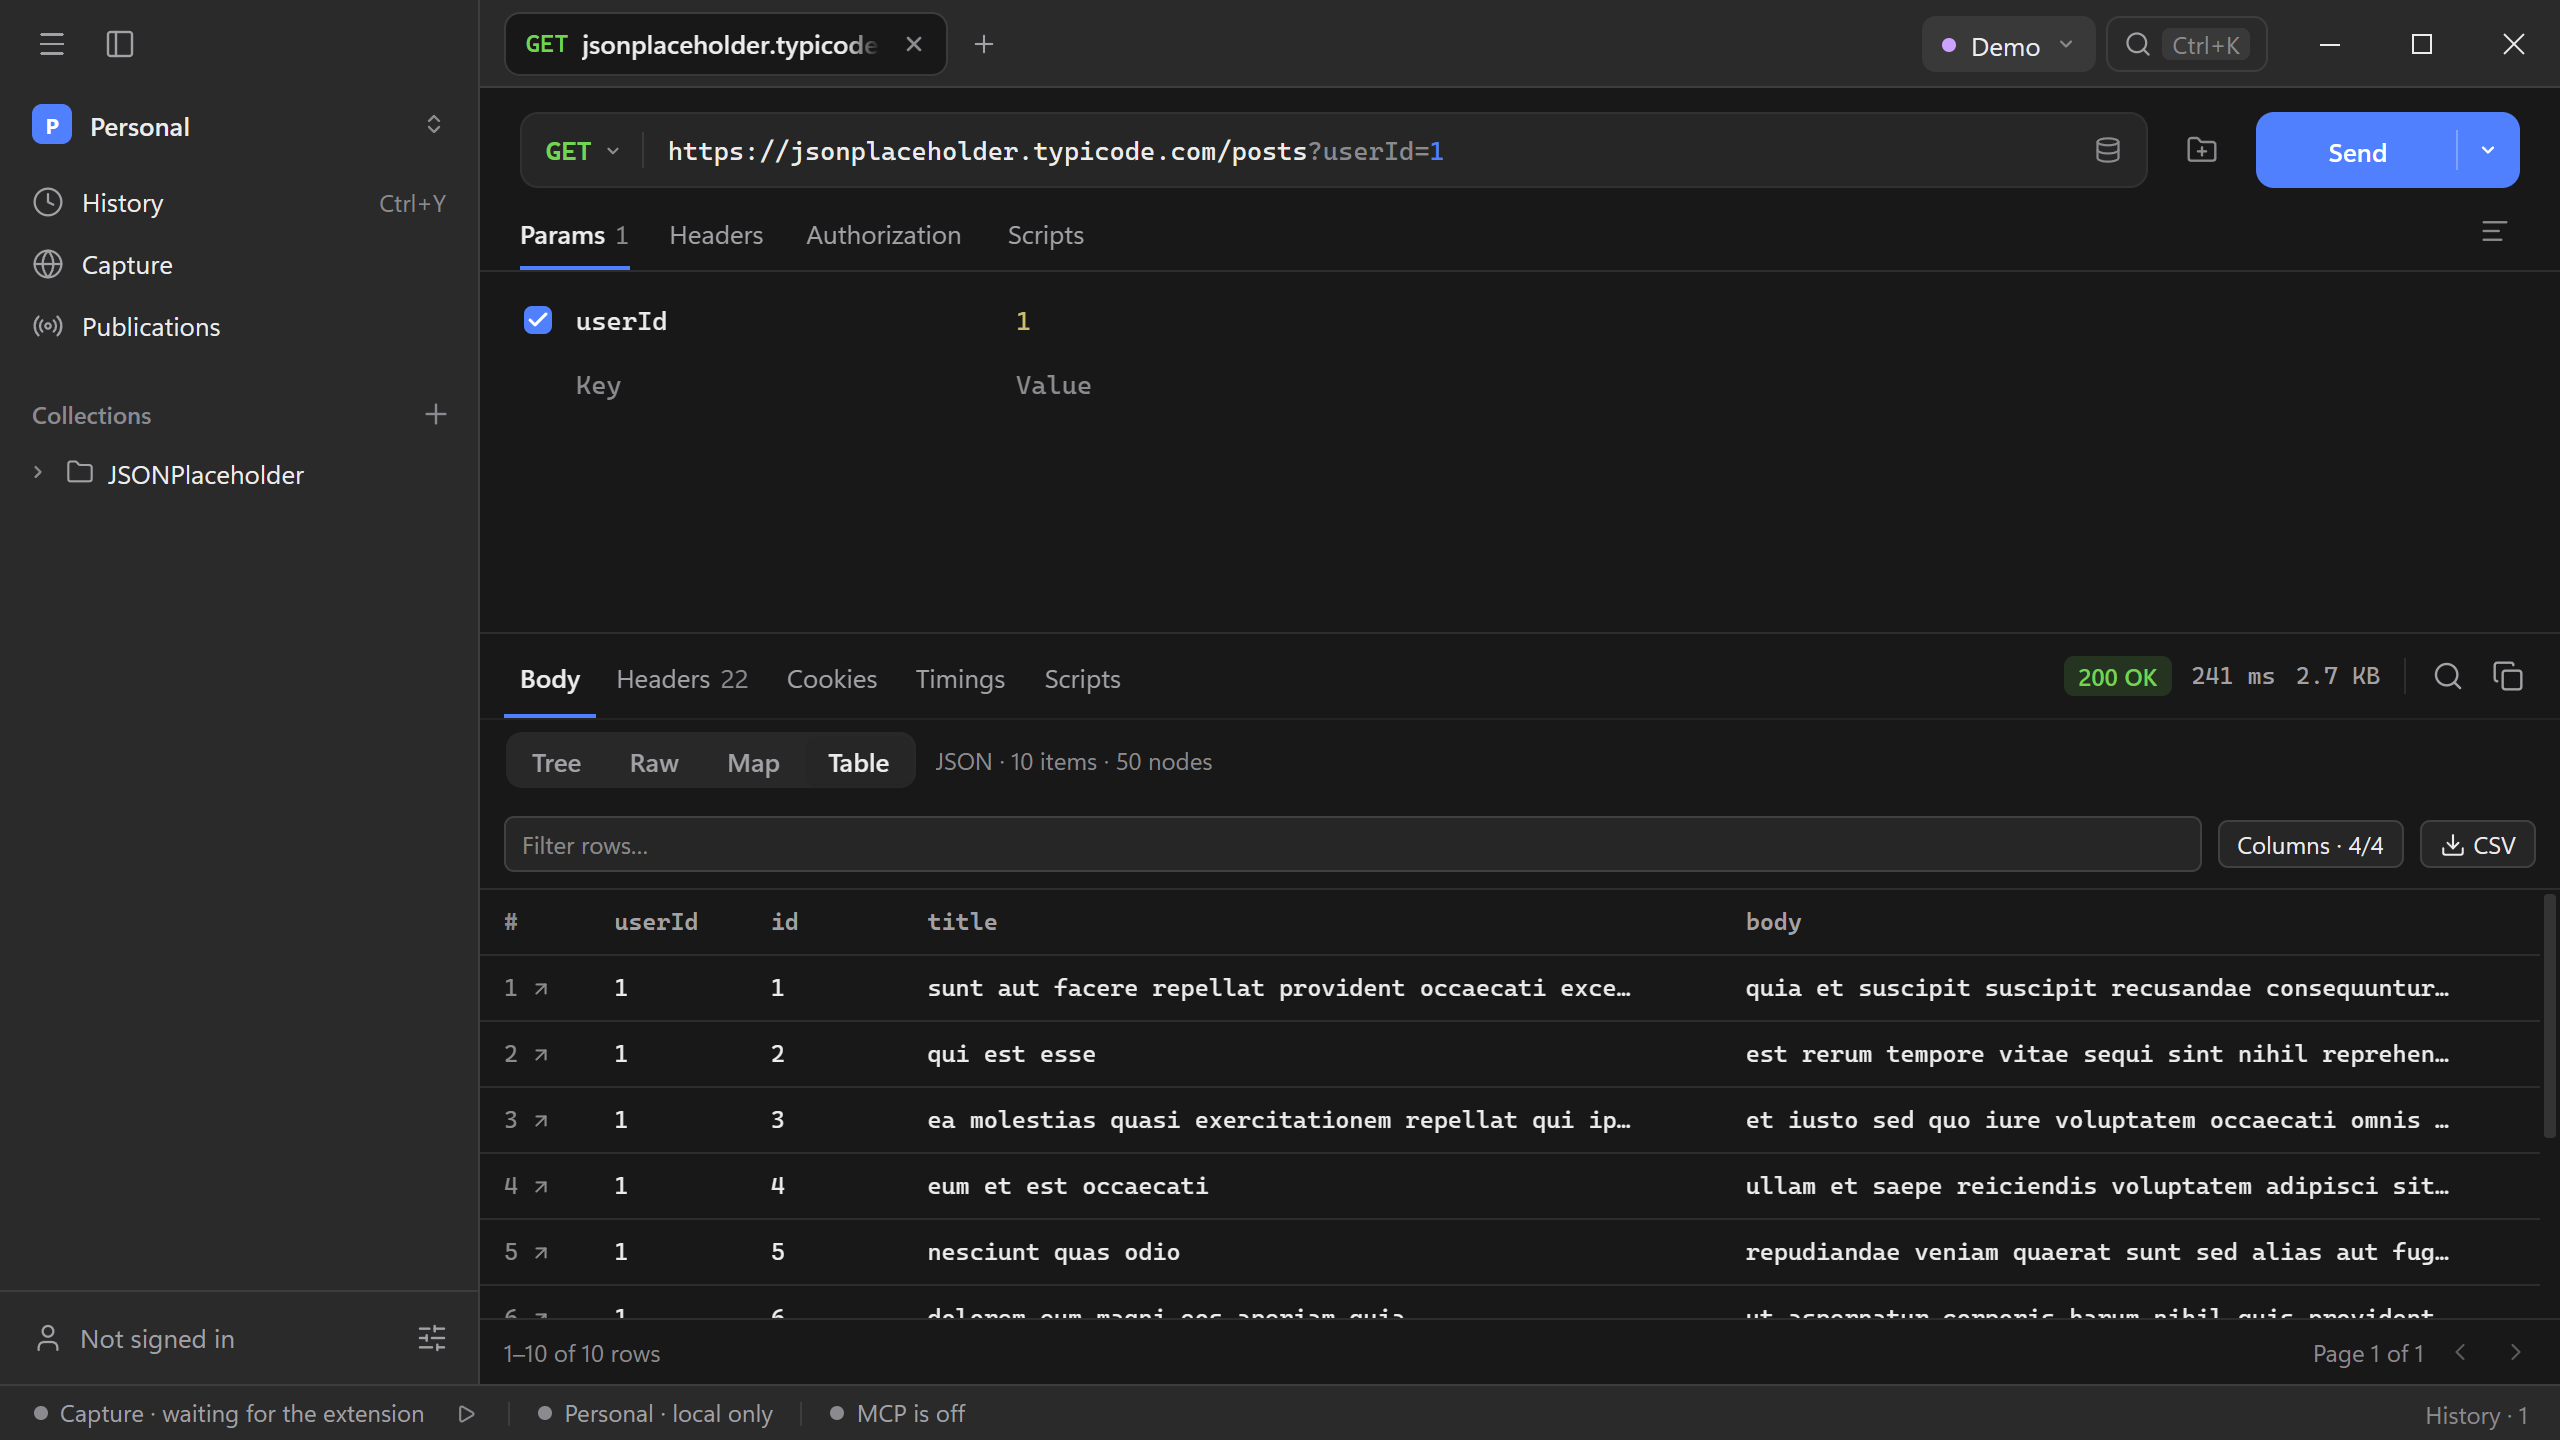
Use Array when the response contains several arrays. Select a row number to inspect its JSON node, or right-click the row for node actions. Columns controls the fields in the view and CSV. CSV saves every matching row in the current sort order across table pages. See Export just the response rows you need.
Read the map
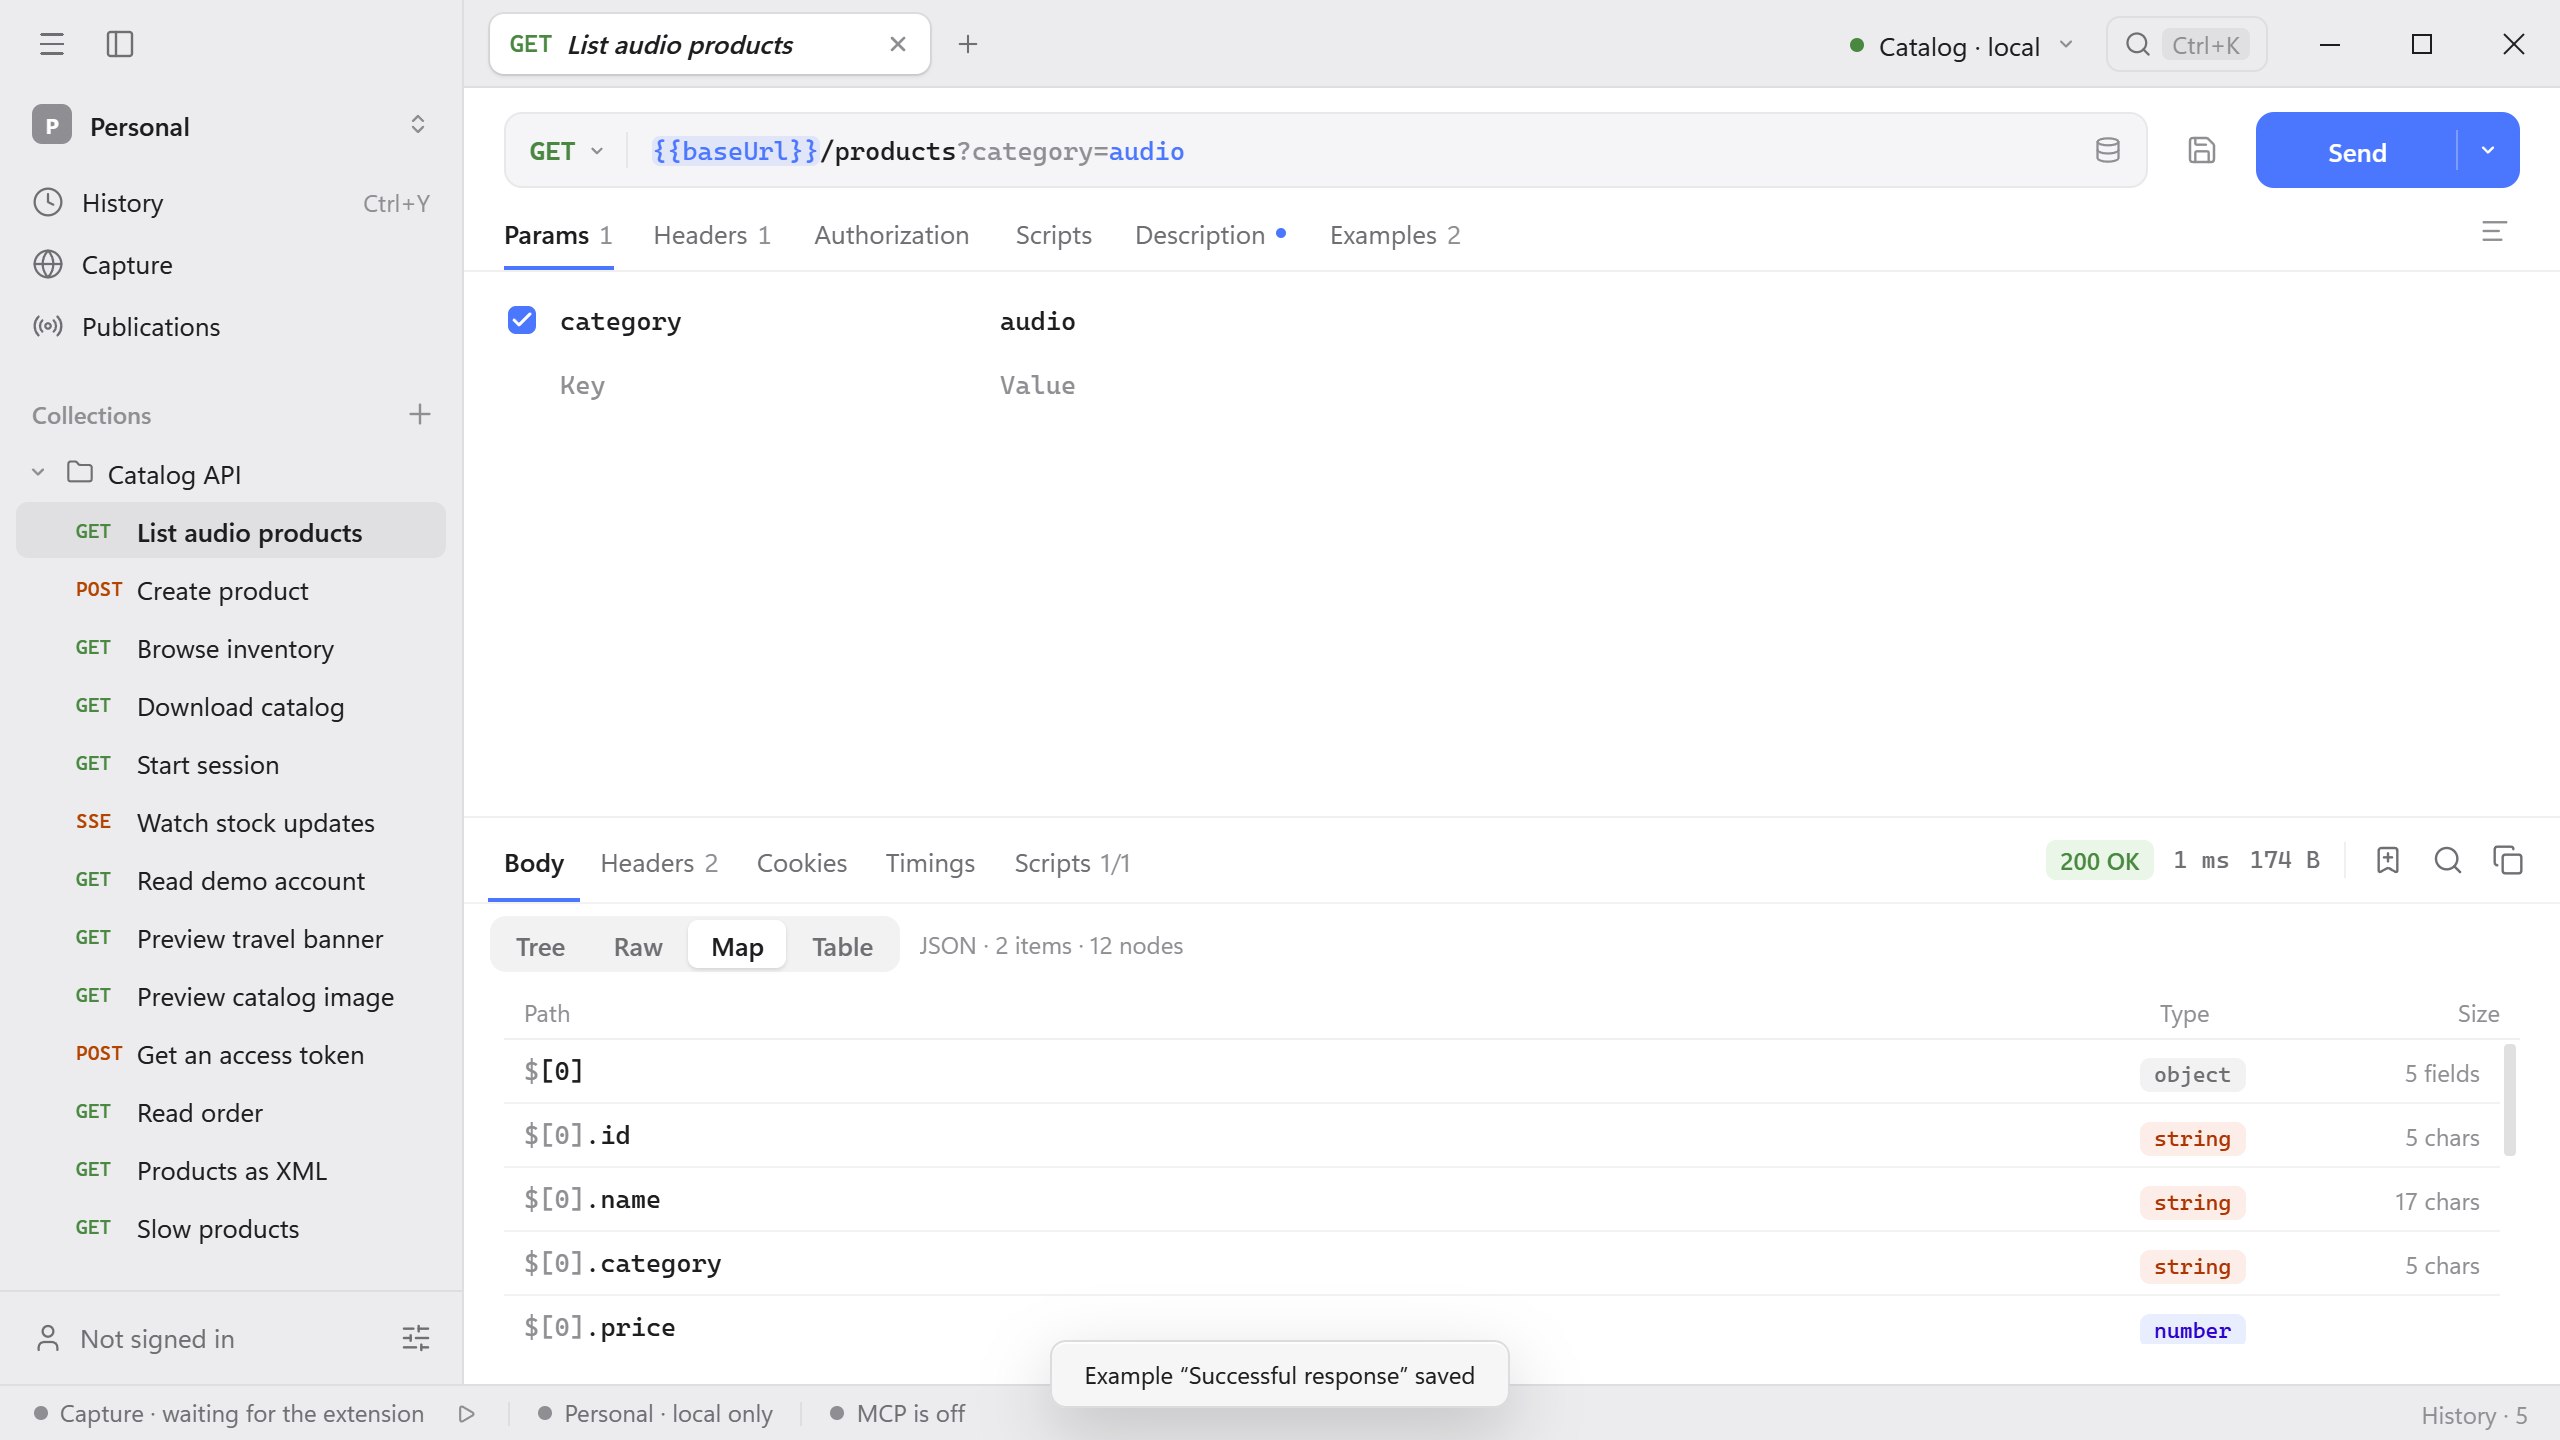
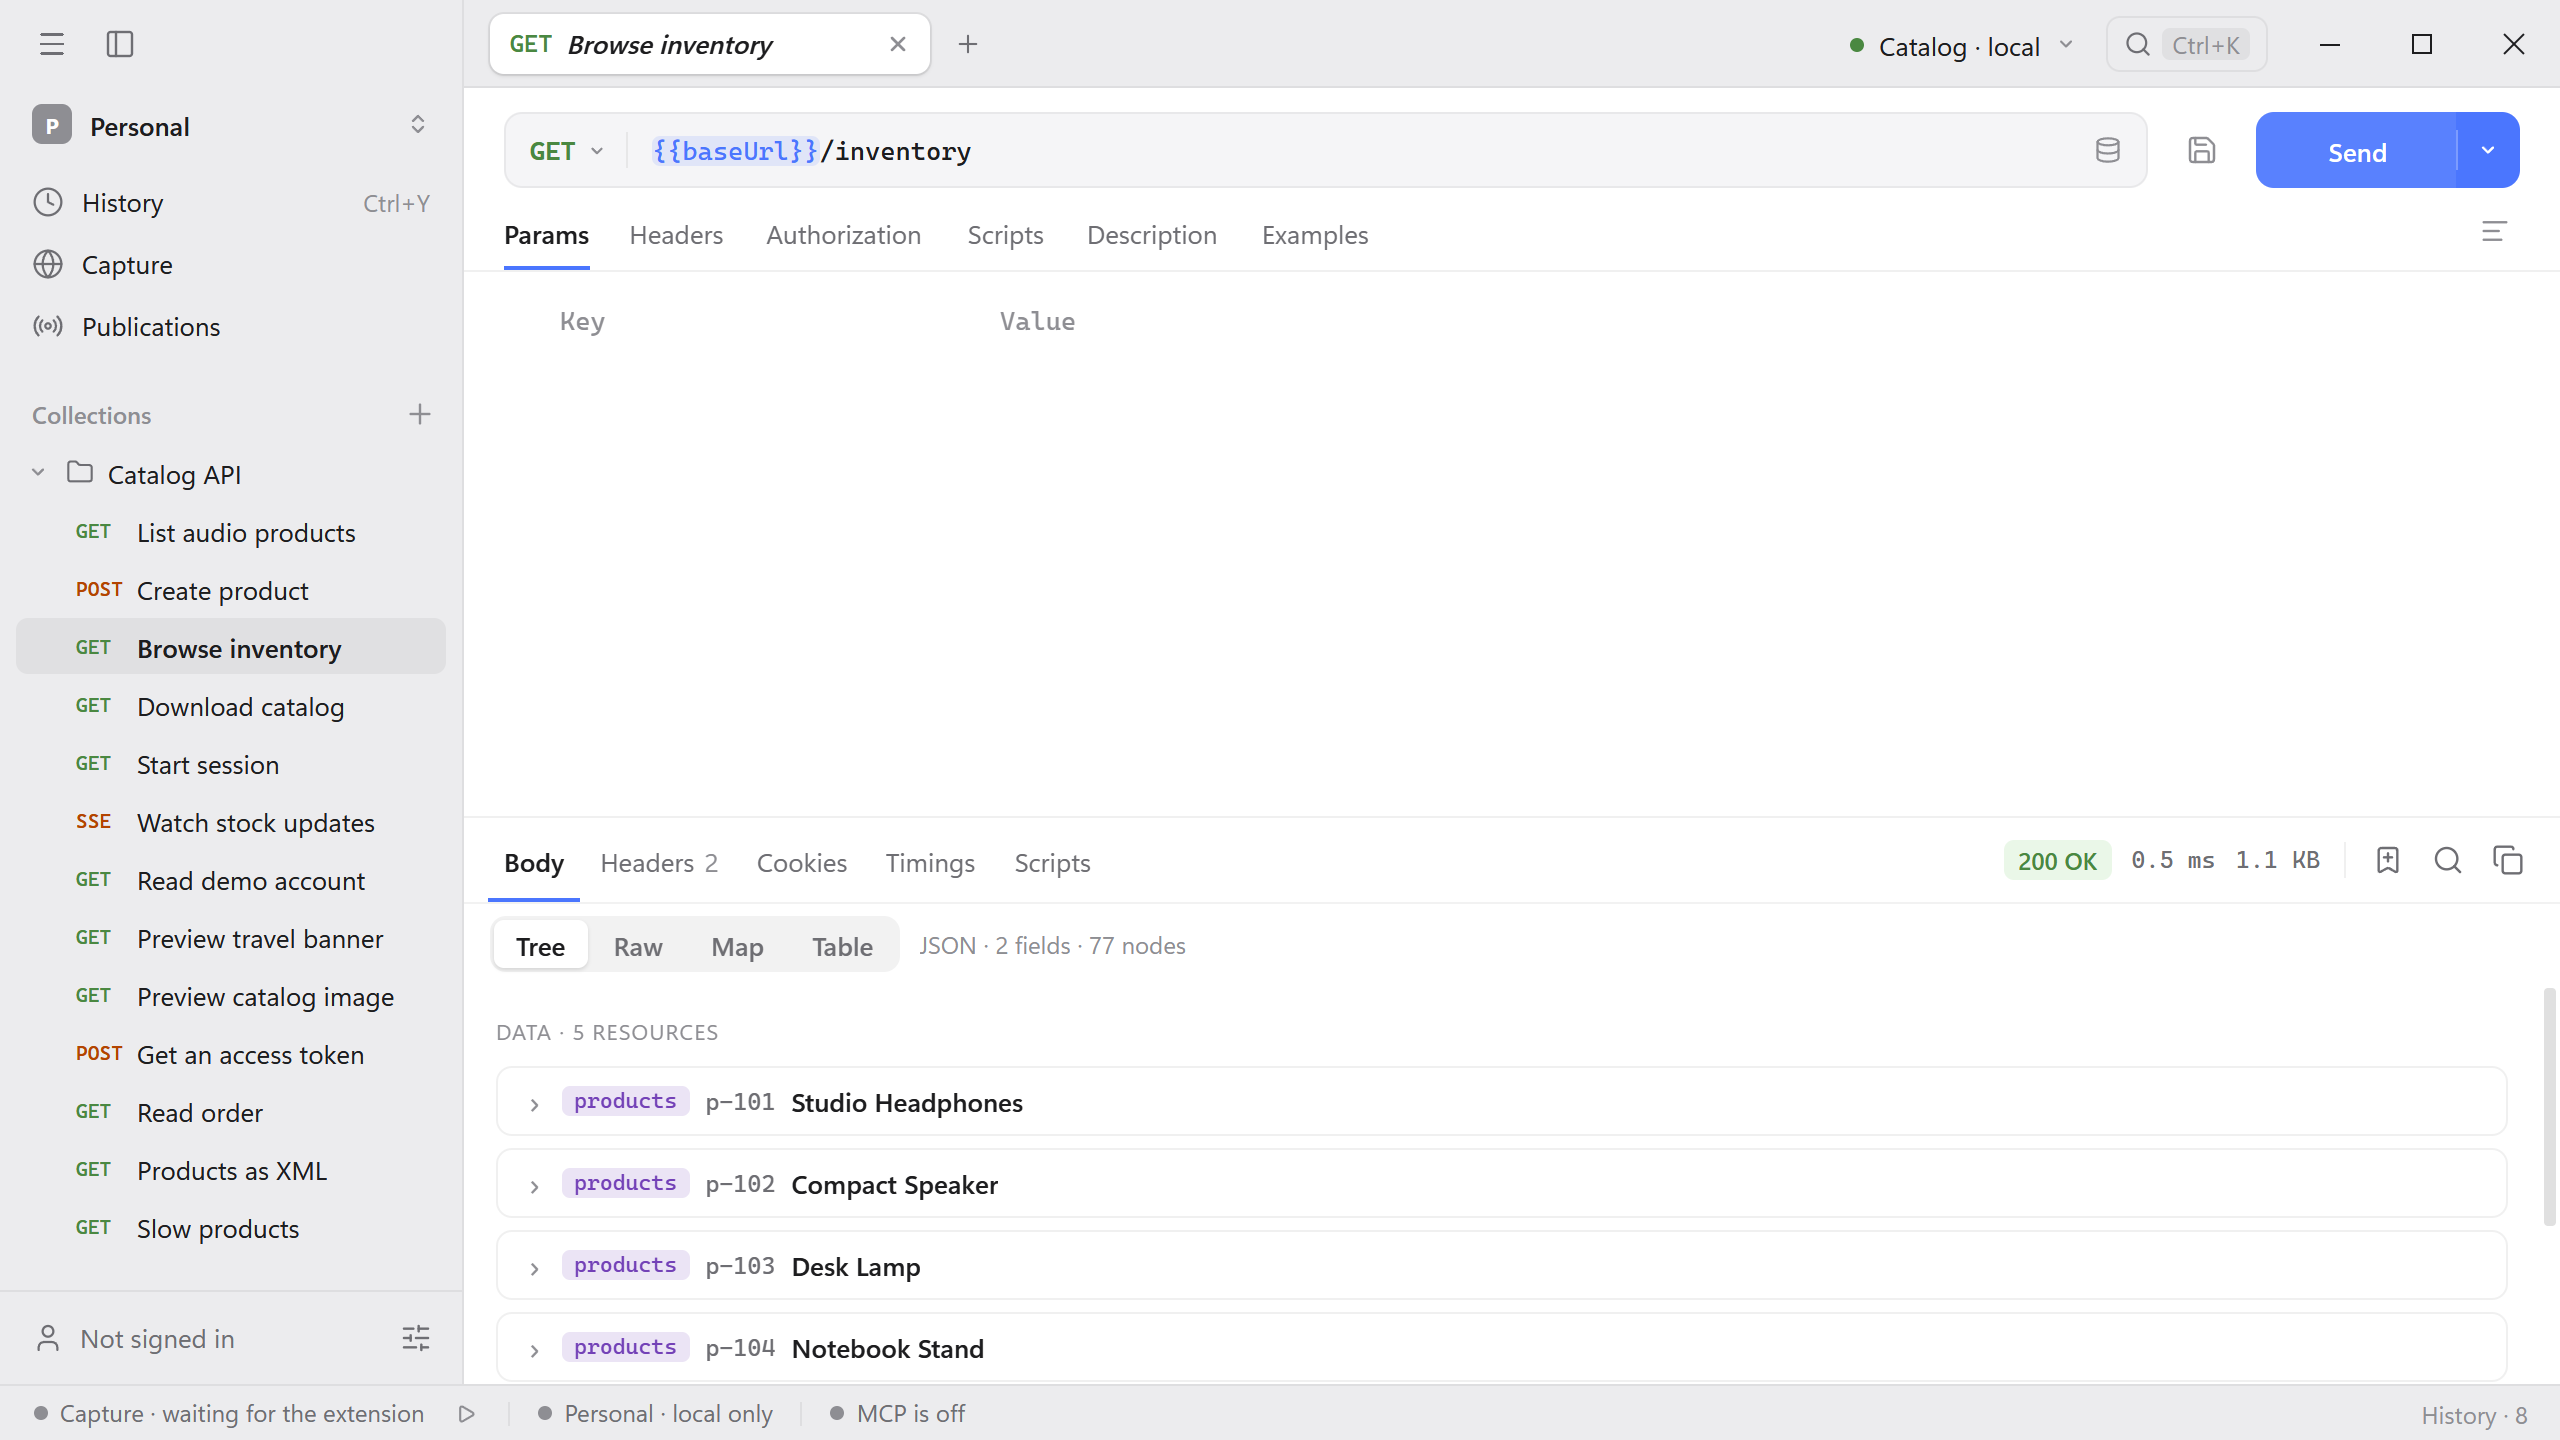
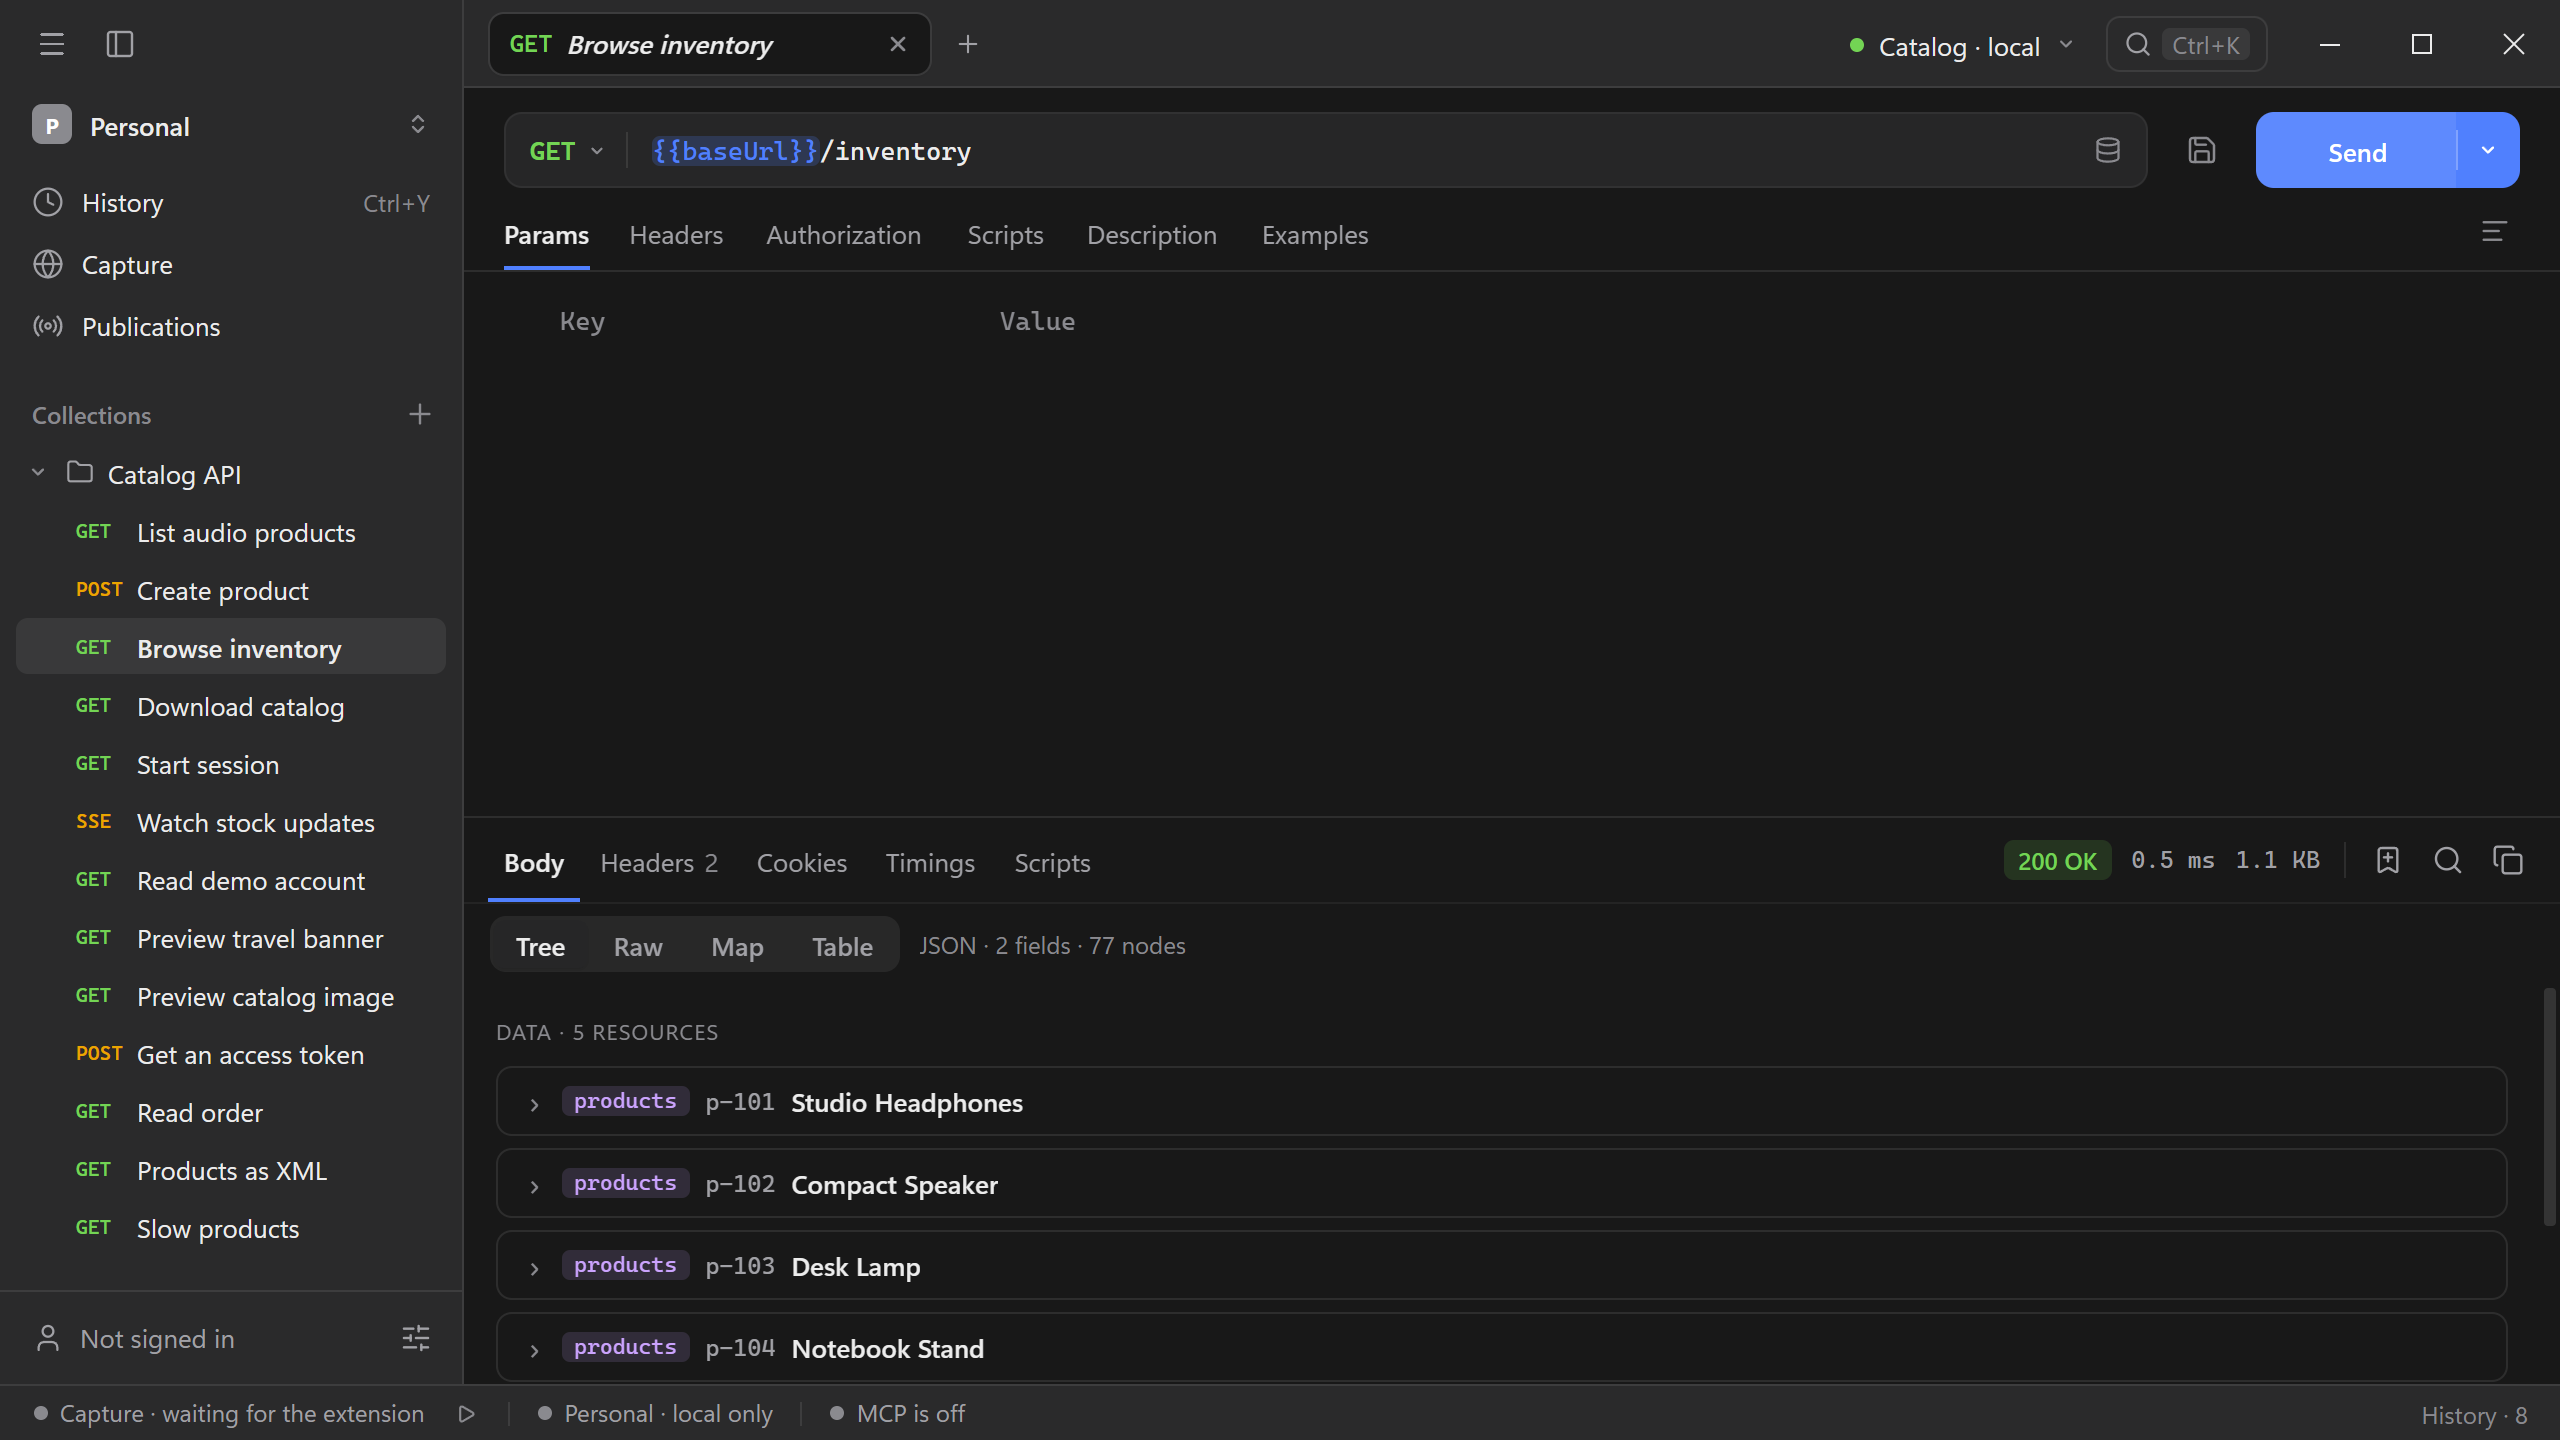
Select Map to get an overview of an unfamiliar response. The map groups entries by their shape, so you can see the fields and their types before opening any individual value. For the Catalog API, the product shape groups an ID, name, category, price, and stock flag.
JSON:API links
Send GET http://127.0.0.1:8787/inventory with the Catalog API running. In Tree, open a product and look for its category relationship. Select the relationship to inspect the category in included. Use the breadcrumb to return to the original resource. Switch to Raw when checking the serialized data, relationships, and included members.
XML and text
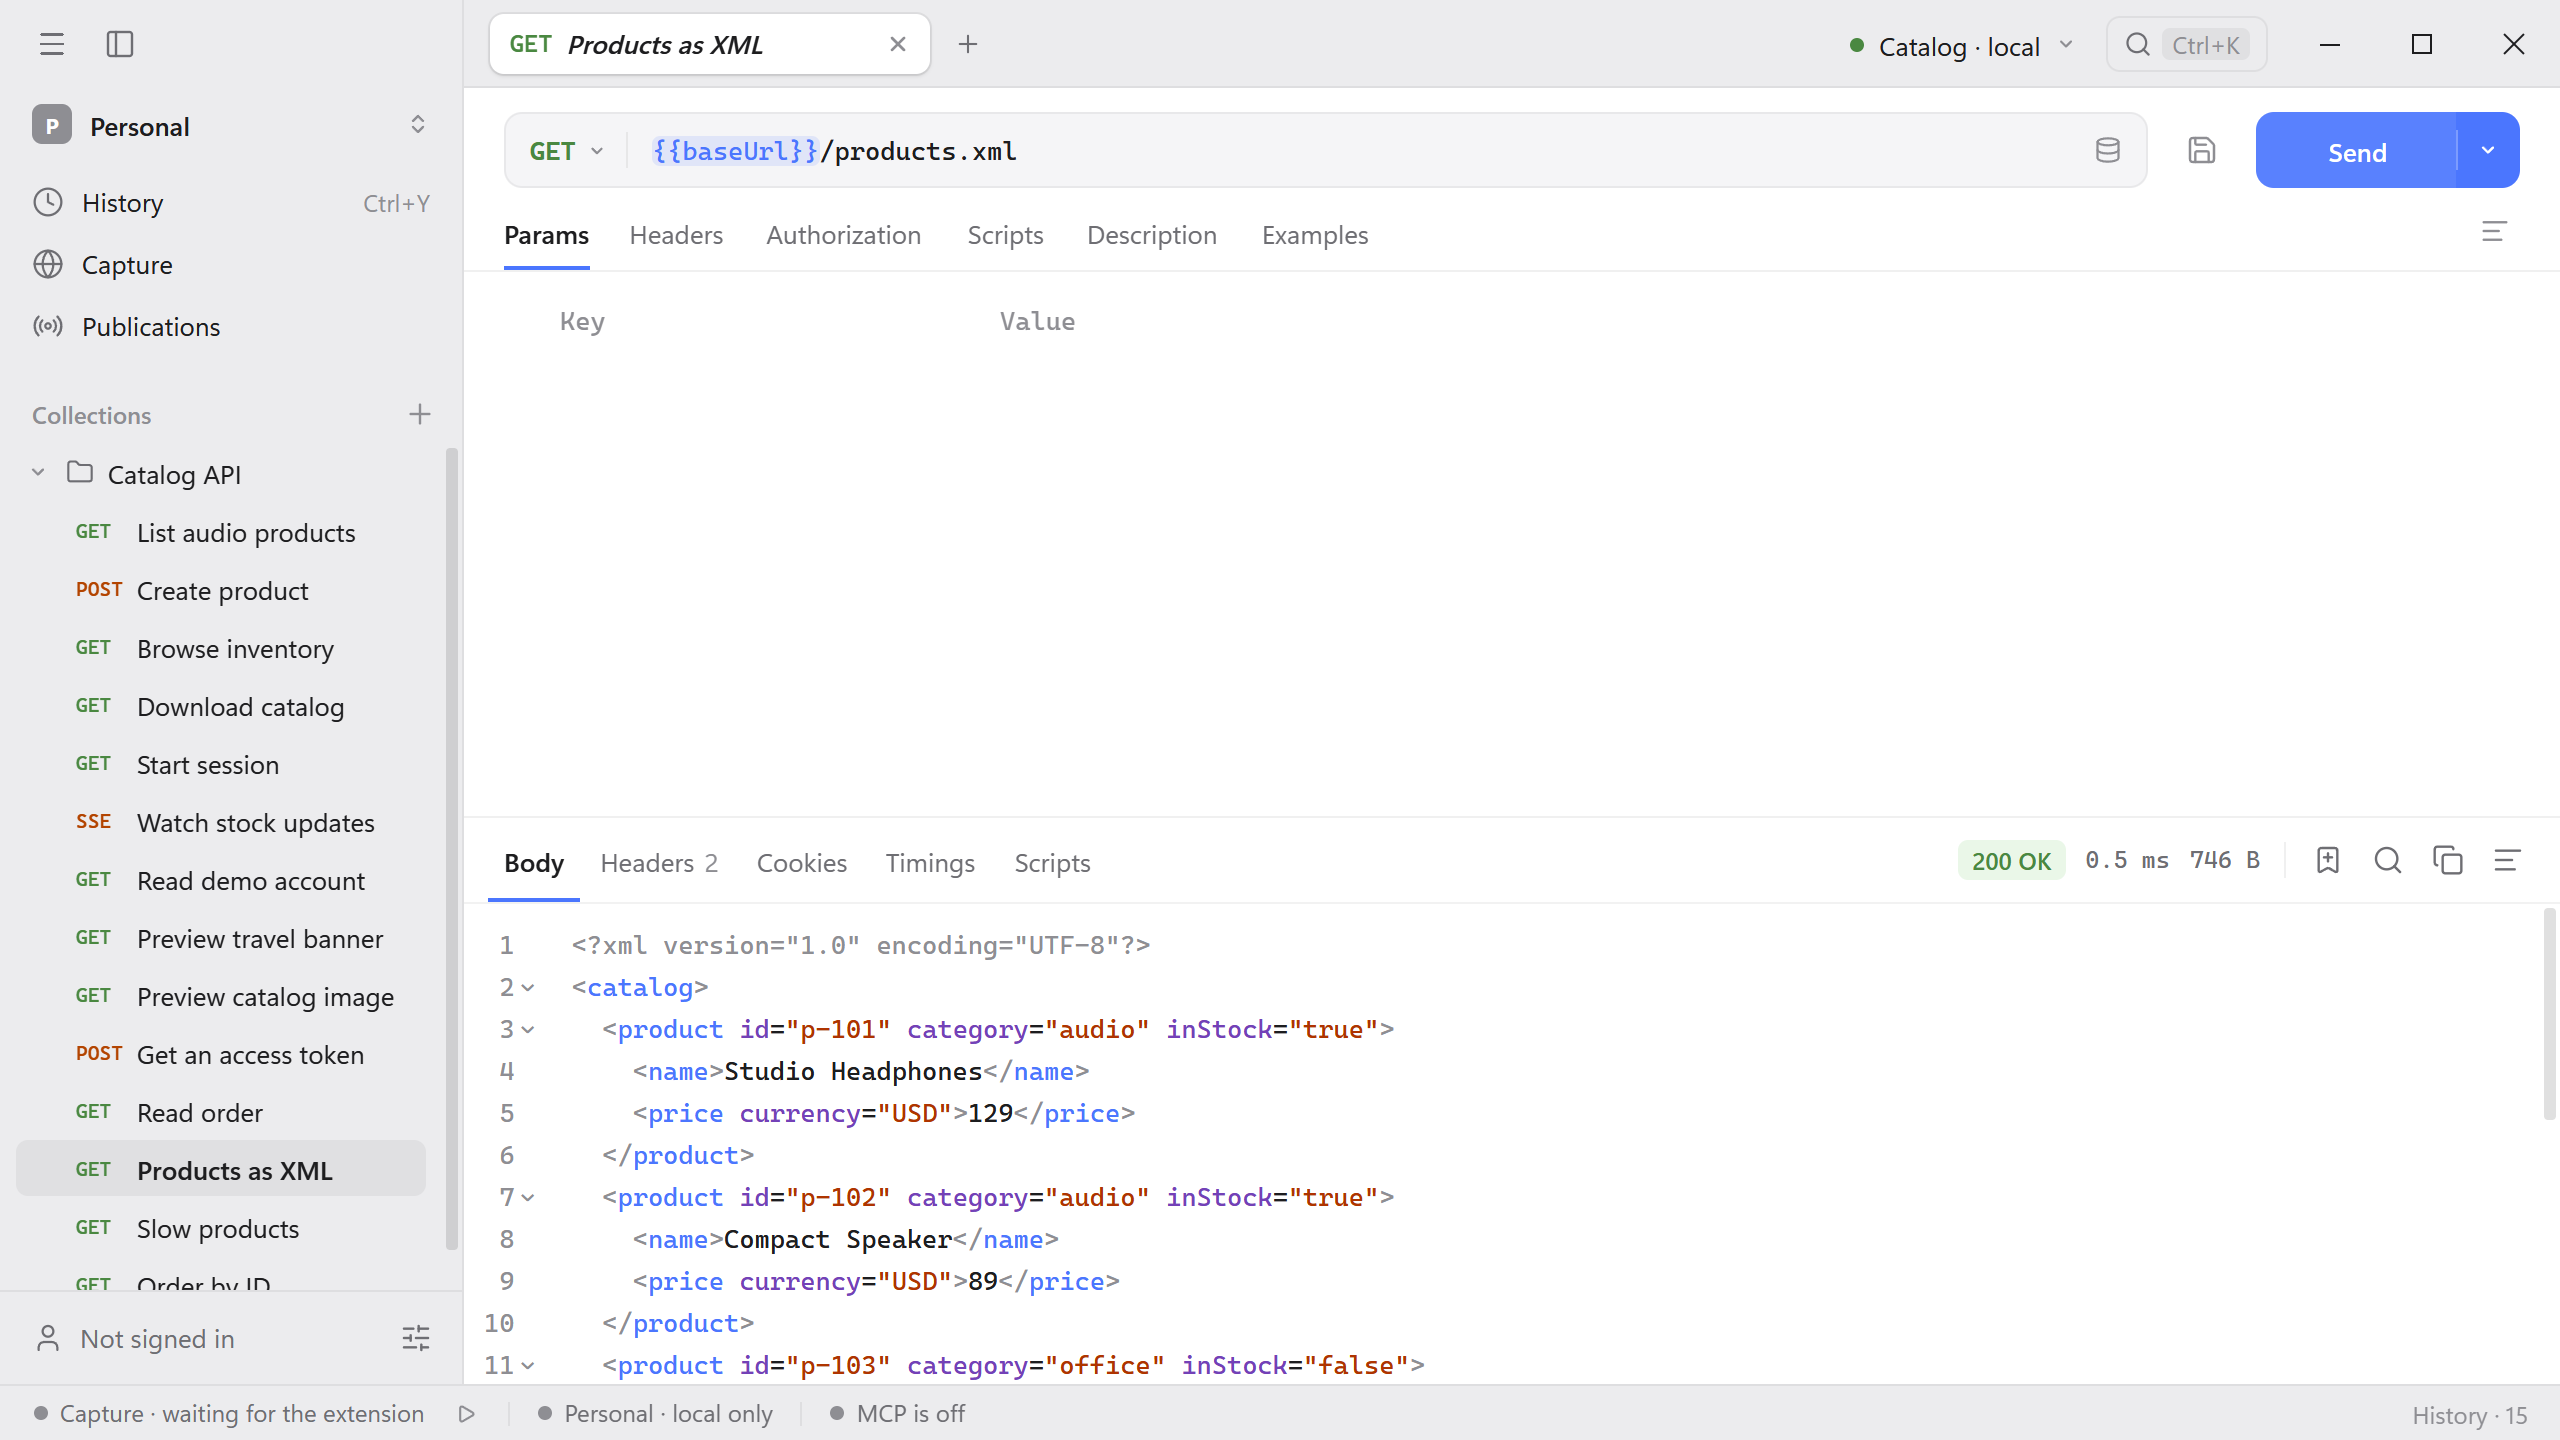
XML, HTML, and other text responses open as highlighted source. Use the arrows in the gutter to fold an element. Try GET {{baseUrl}}/products.xml from the Catalog API.
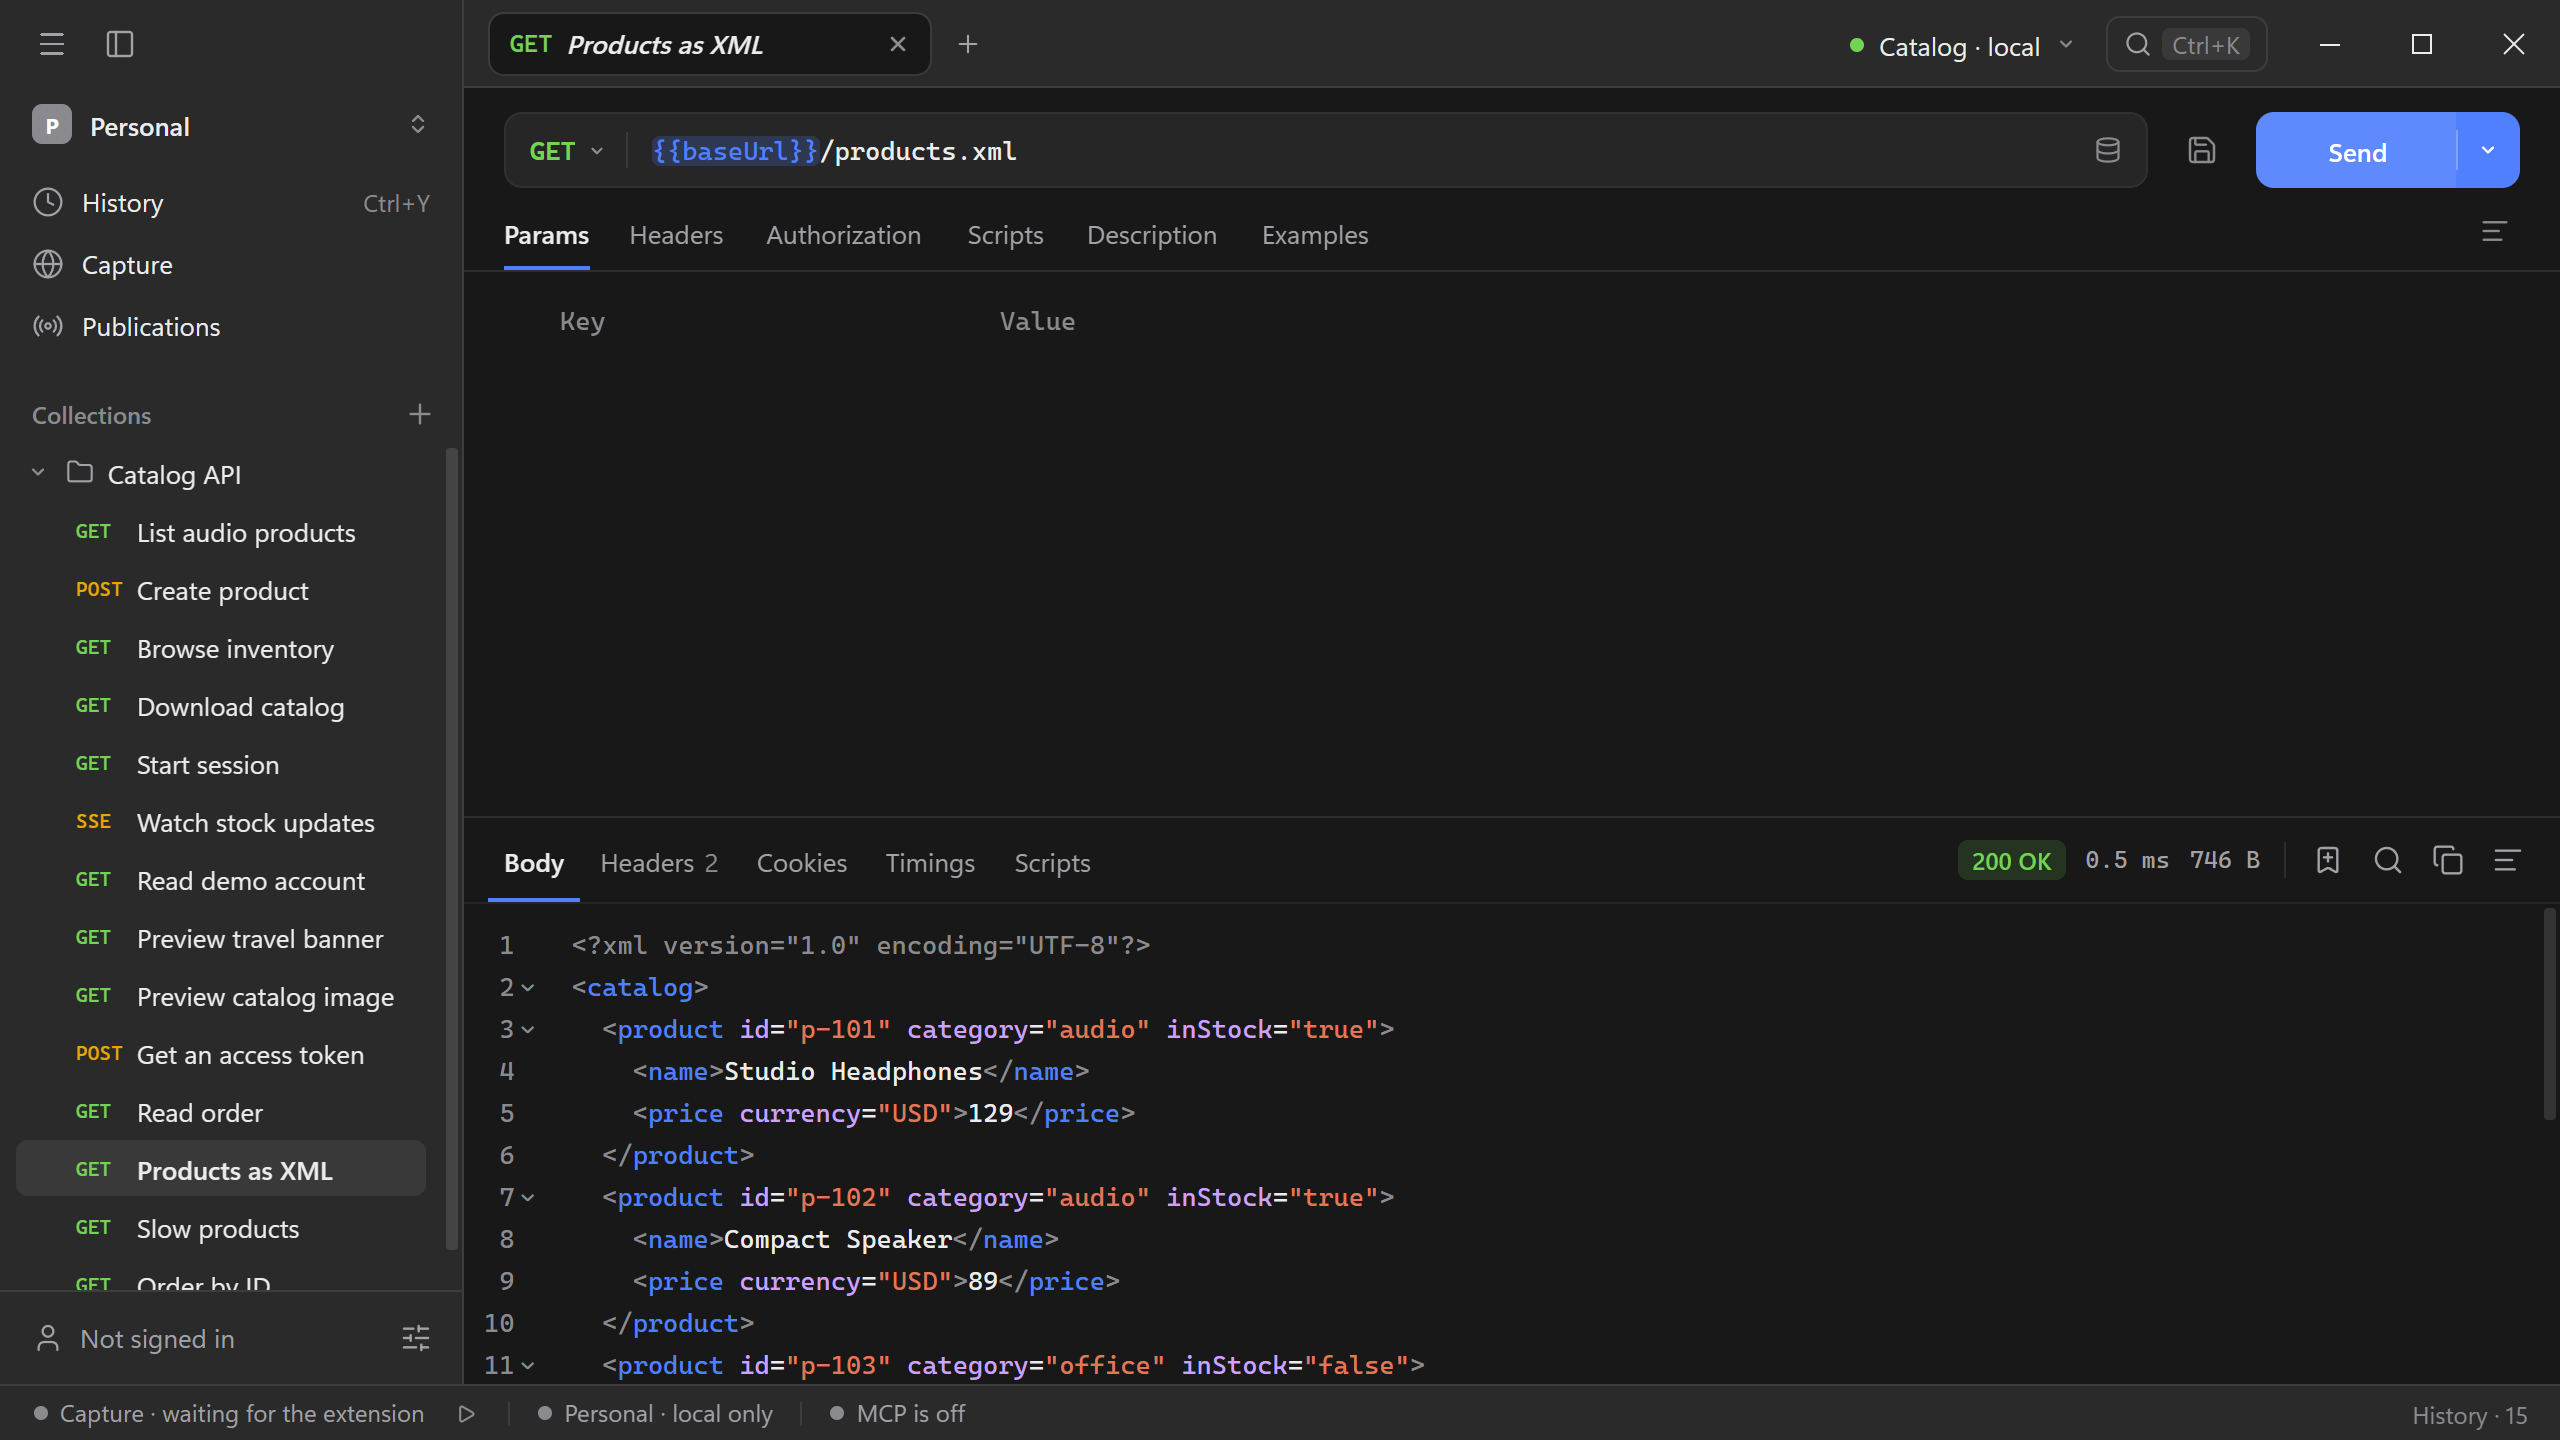
To find text in a searchable body, select the search icon in the response bar or press Cmd/Ctrl + F. Use the copy icon to copy the whole body.
Node inspector
Select a value in Tree and open its node actions to copy the value or its path, decode it, produce types, or keep it in a variable. See Node inspector.
Headers and timing
| Tab | What to check |
|---|---|
| Headers | Verify response headers such as Content-Type, Location, and cache directives. |
| Cookies | Look for cookies returned or sent during the request. |
| Timings | See how long each phase of the exchange took. |
| Scripts | Review output and post-response test results when the request runs a script. |
Timings shows the total time and how much of it was spent waiting for the first byte, then a bar for each phase: DNS, TCP connect, TLS, Waiting for the answer, and Downloading. The note under the bars tells you whether Schemo opened a new connection to the host or reused one, in which case no DNS, TCP, or TLS time was spent.
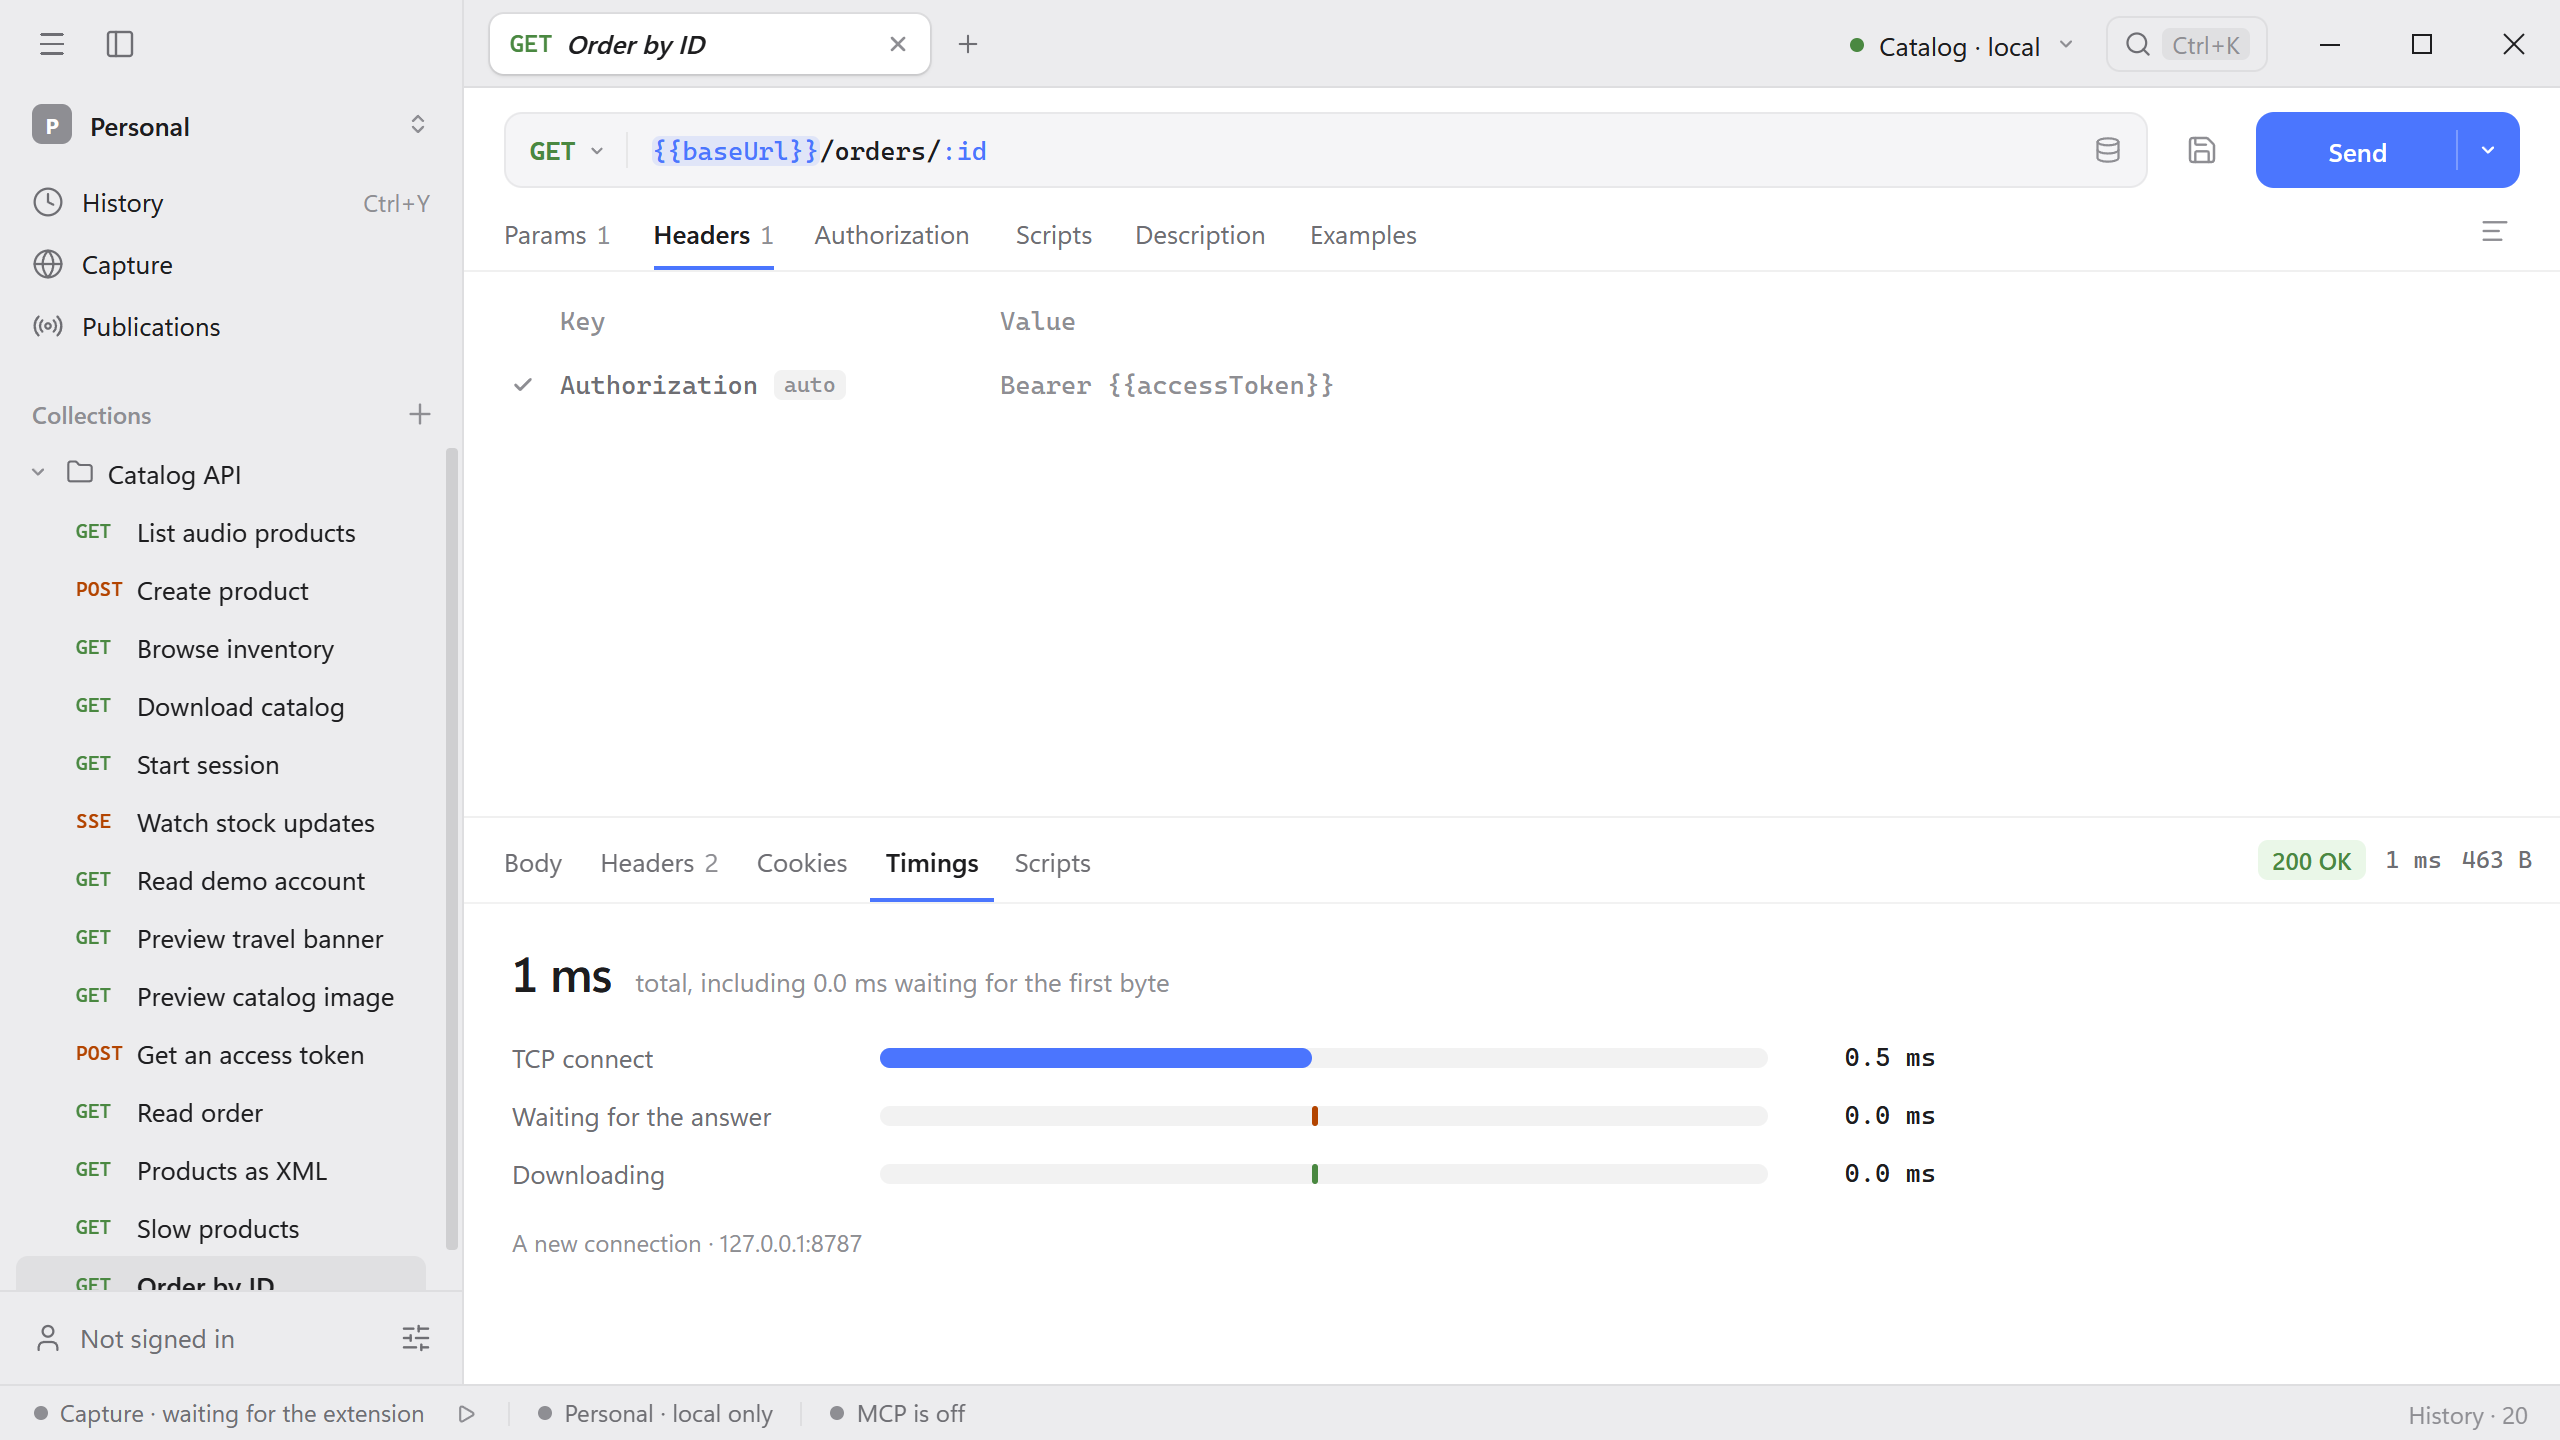
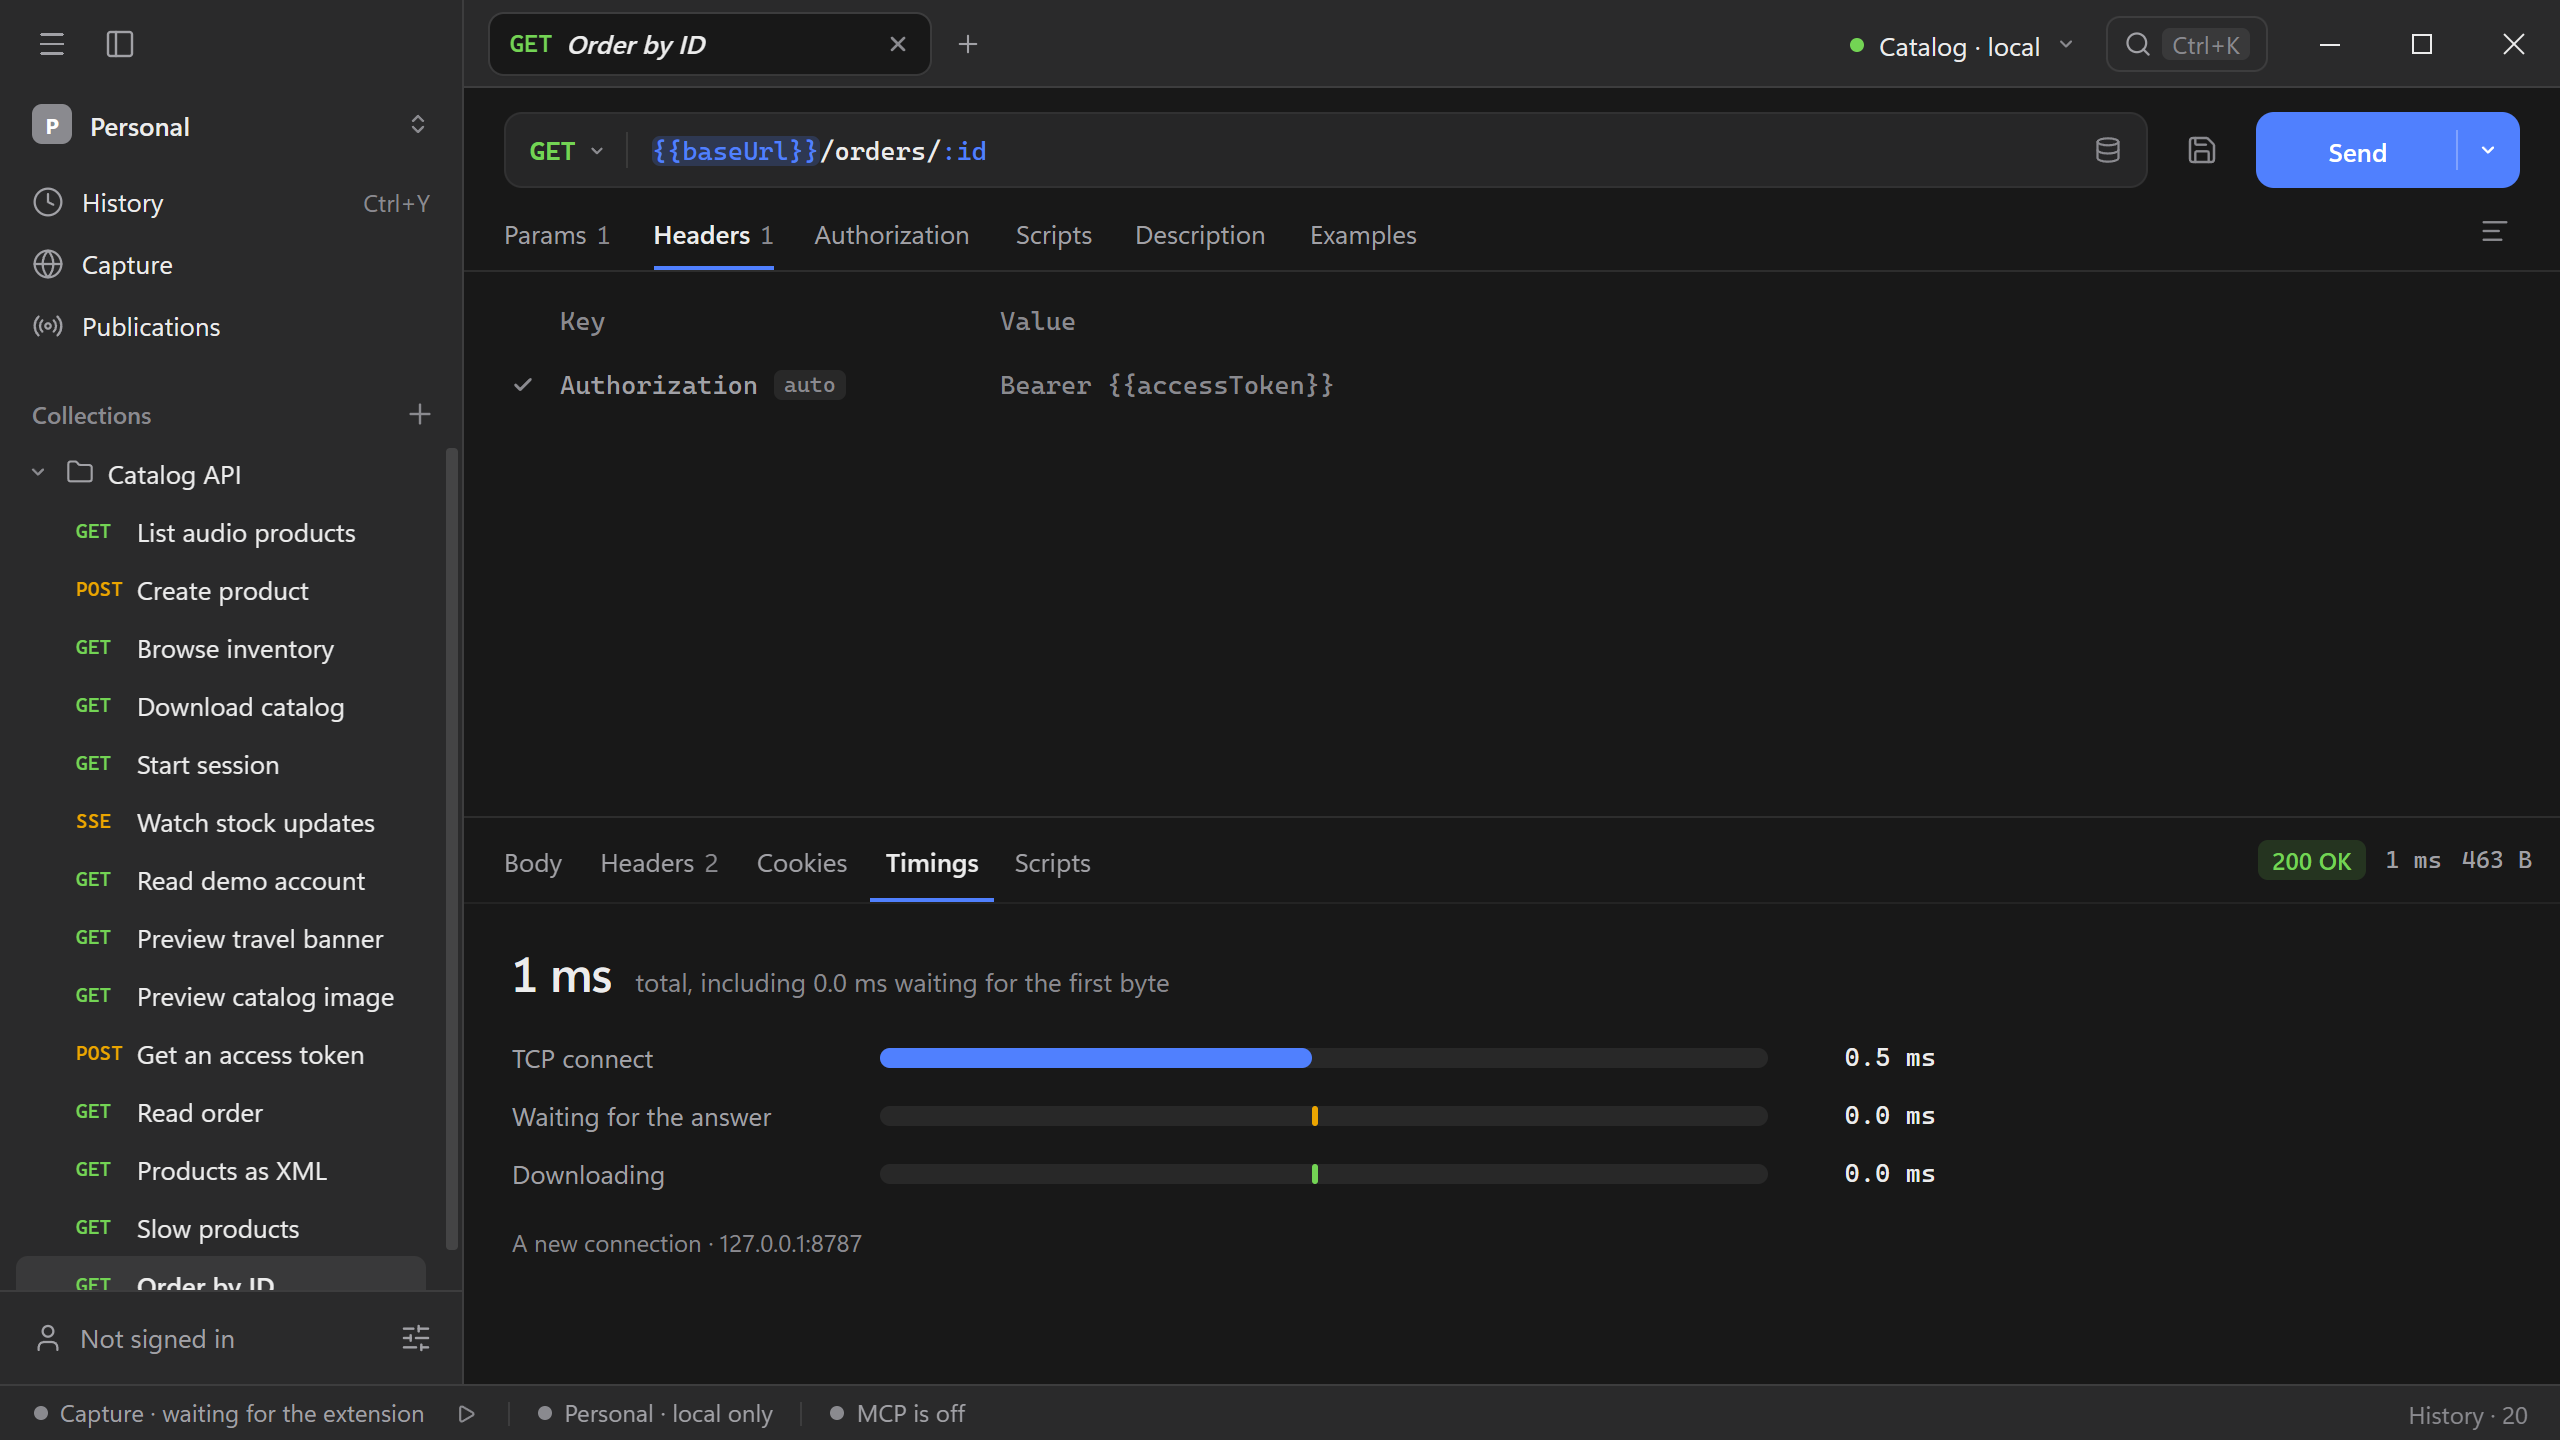
See Find where a slow request spent its time for a reproducible slow reply.
A request captured from the browser has no address bar above it, so its response pane adds a Request tab with the method, headers, and body that the page sent.
Binary responses
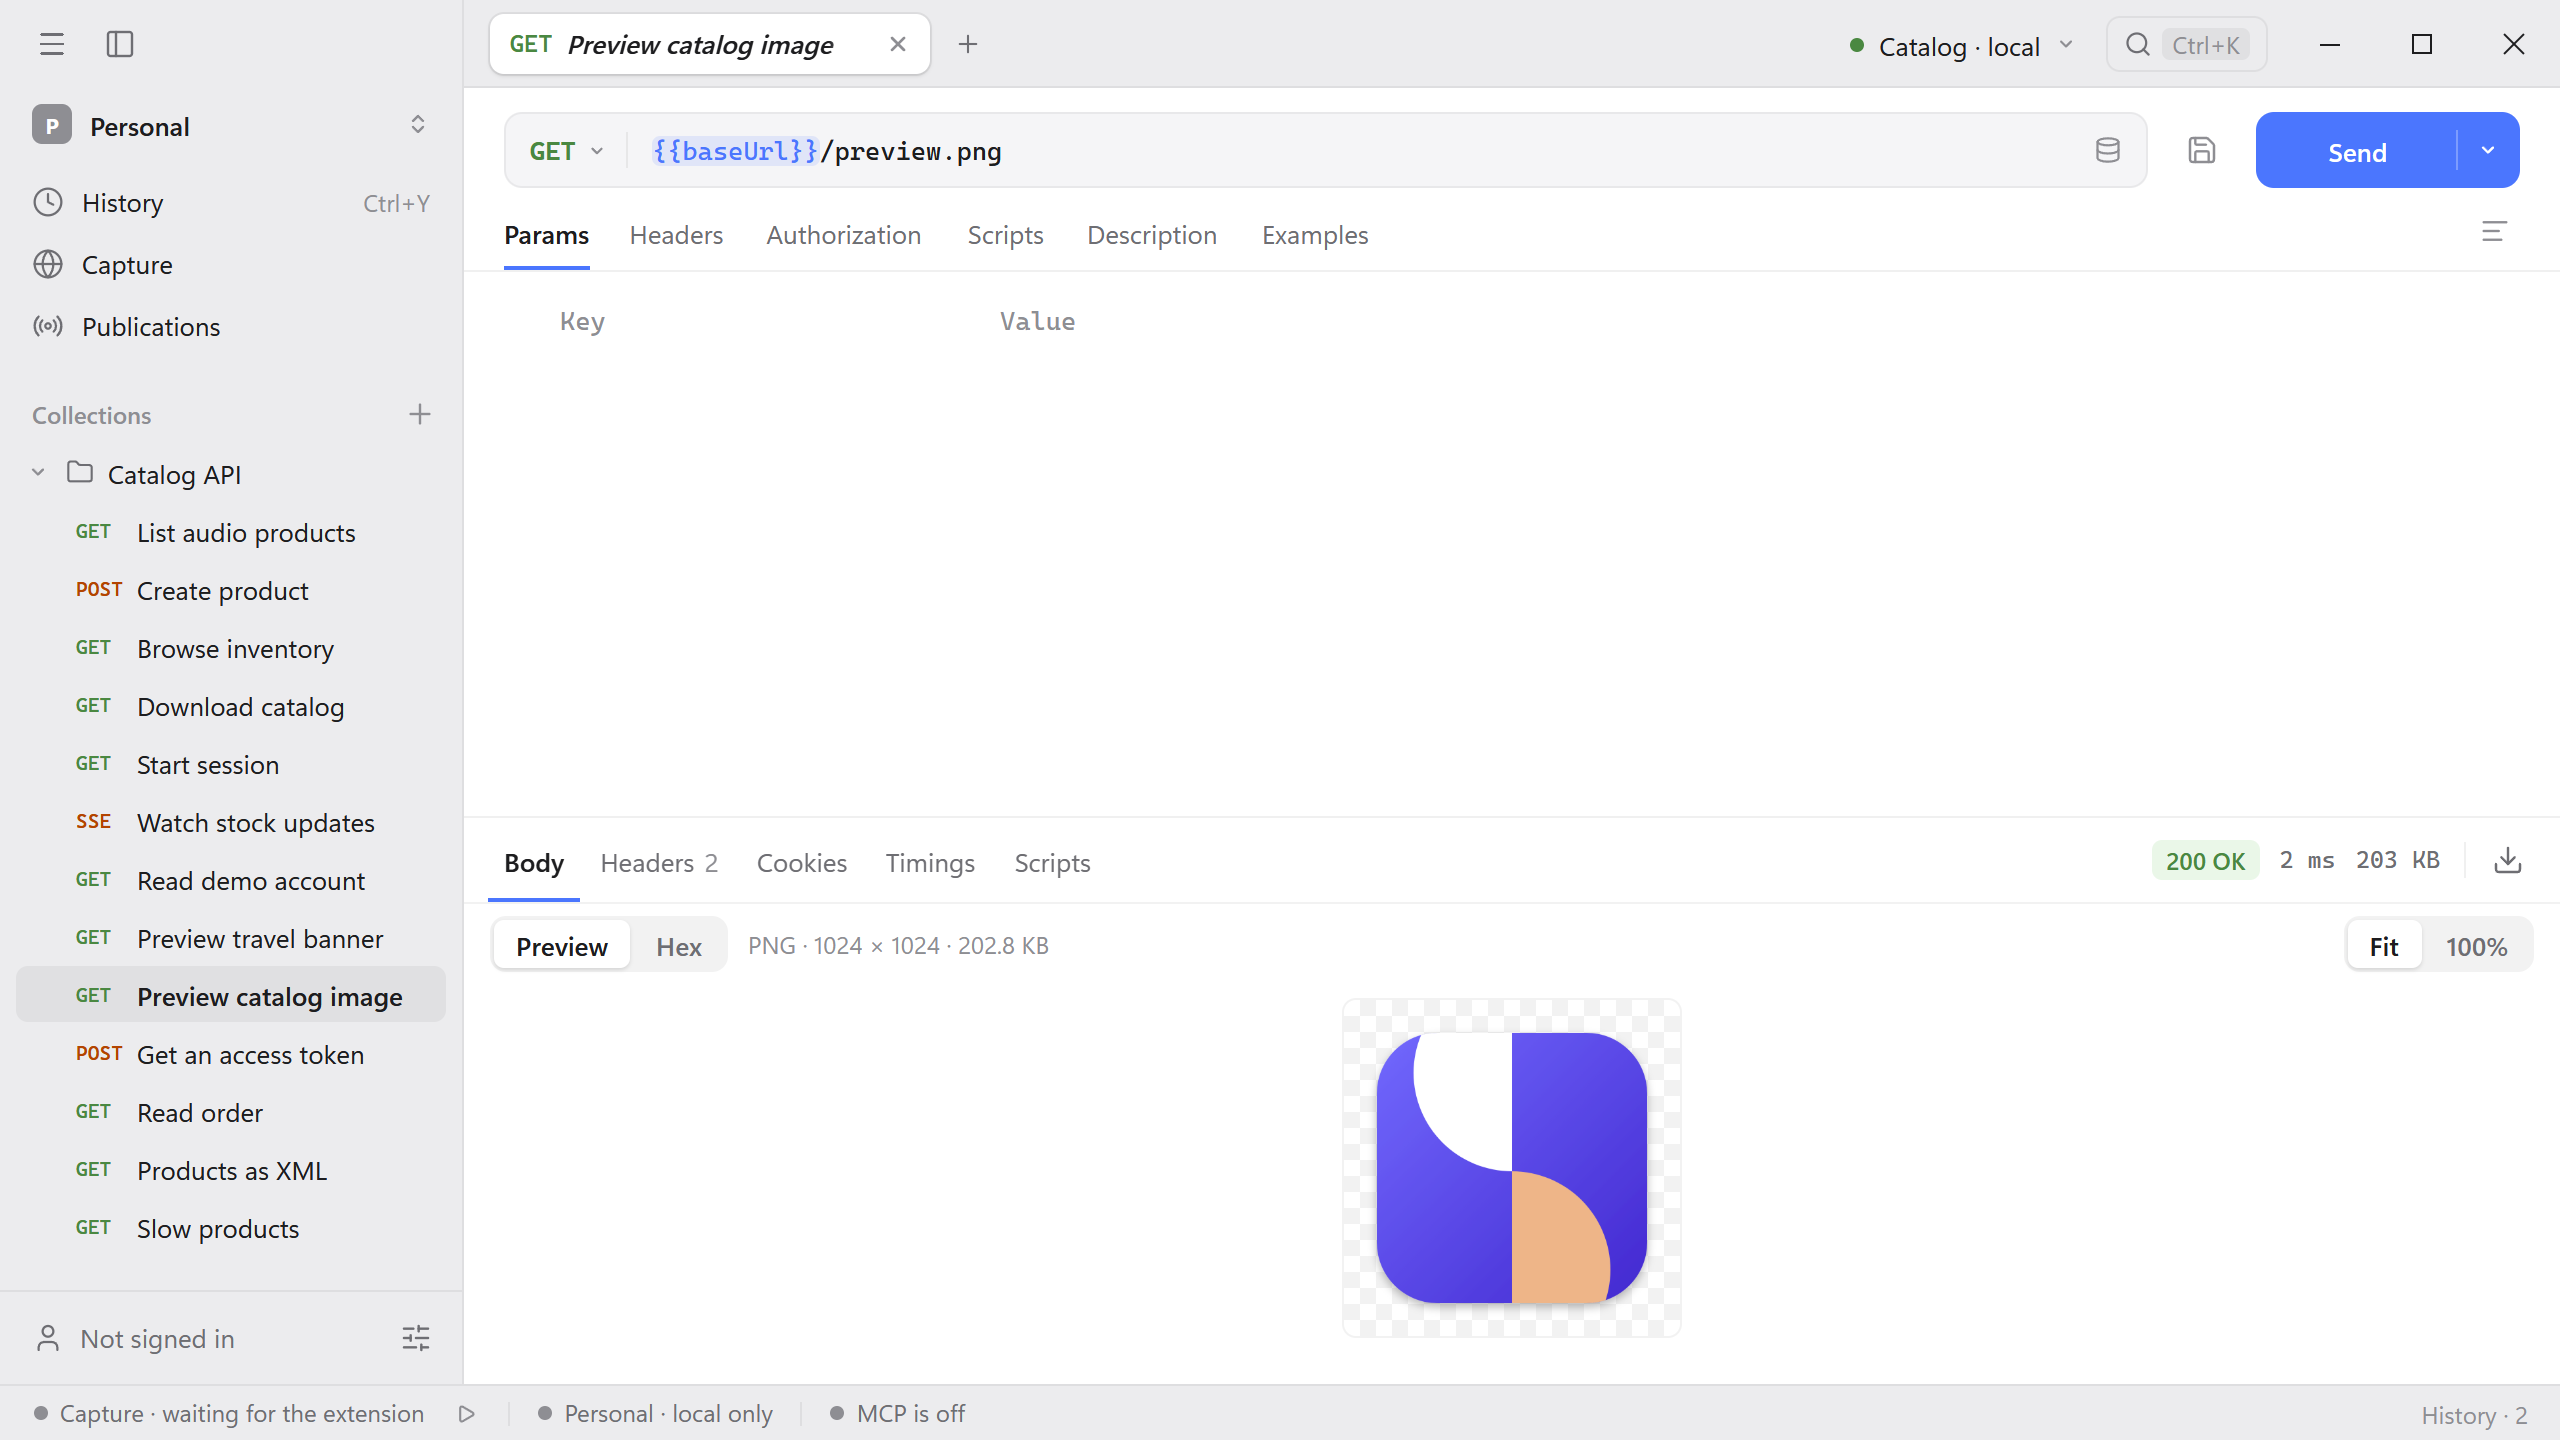
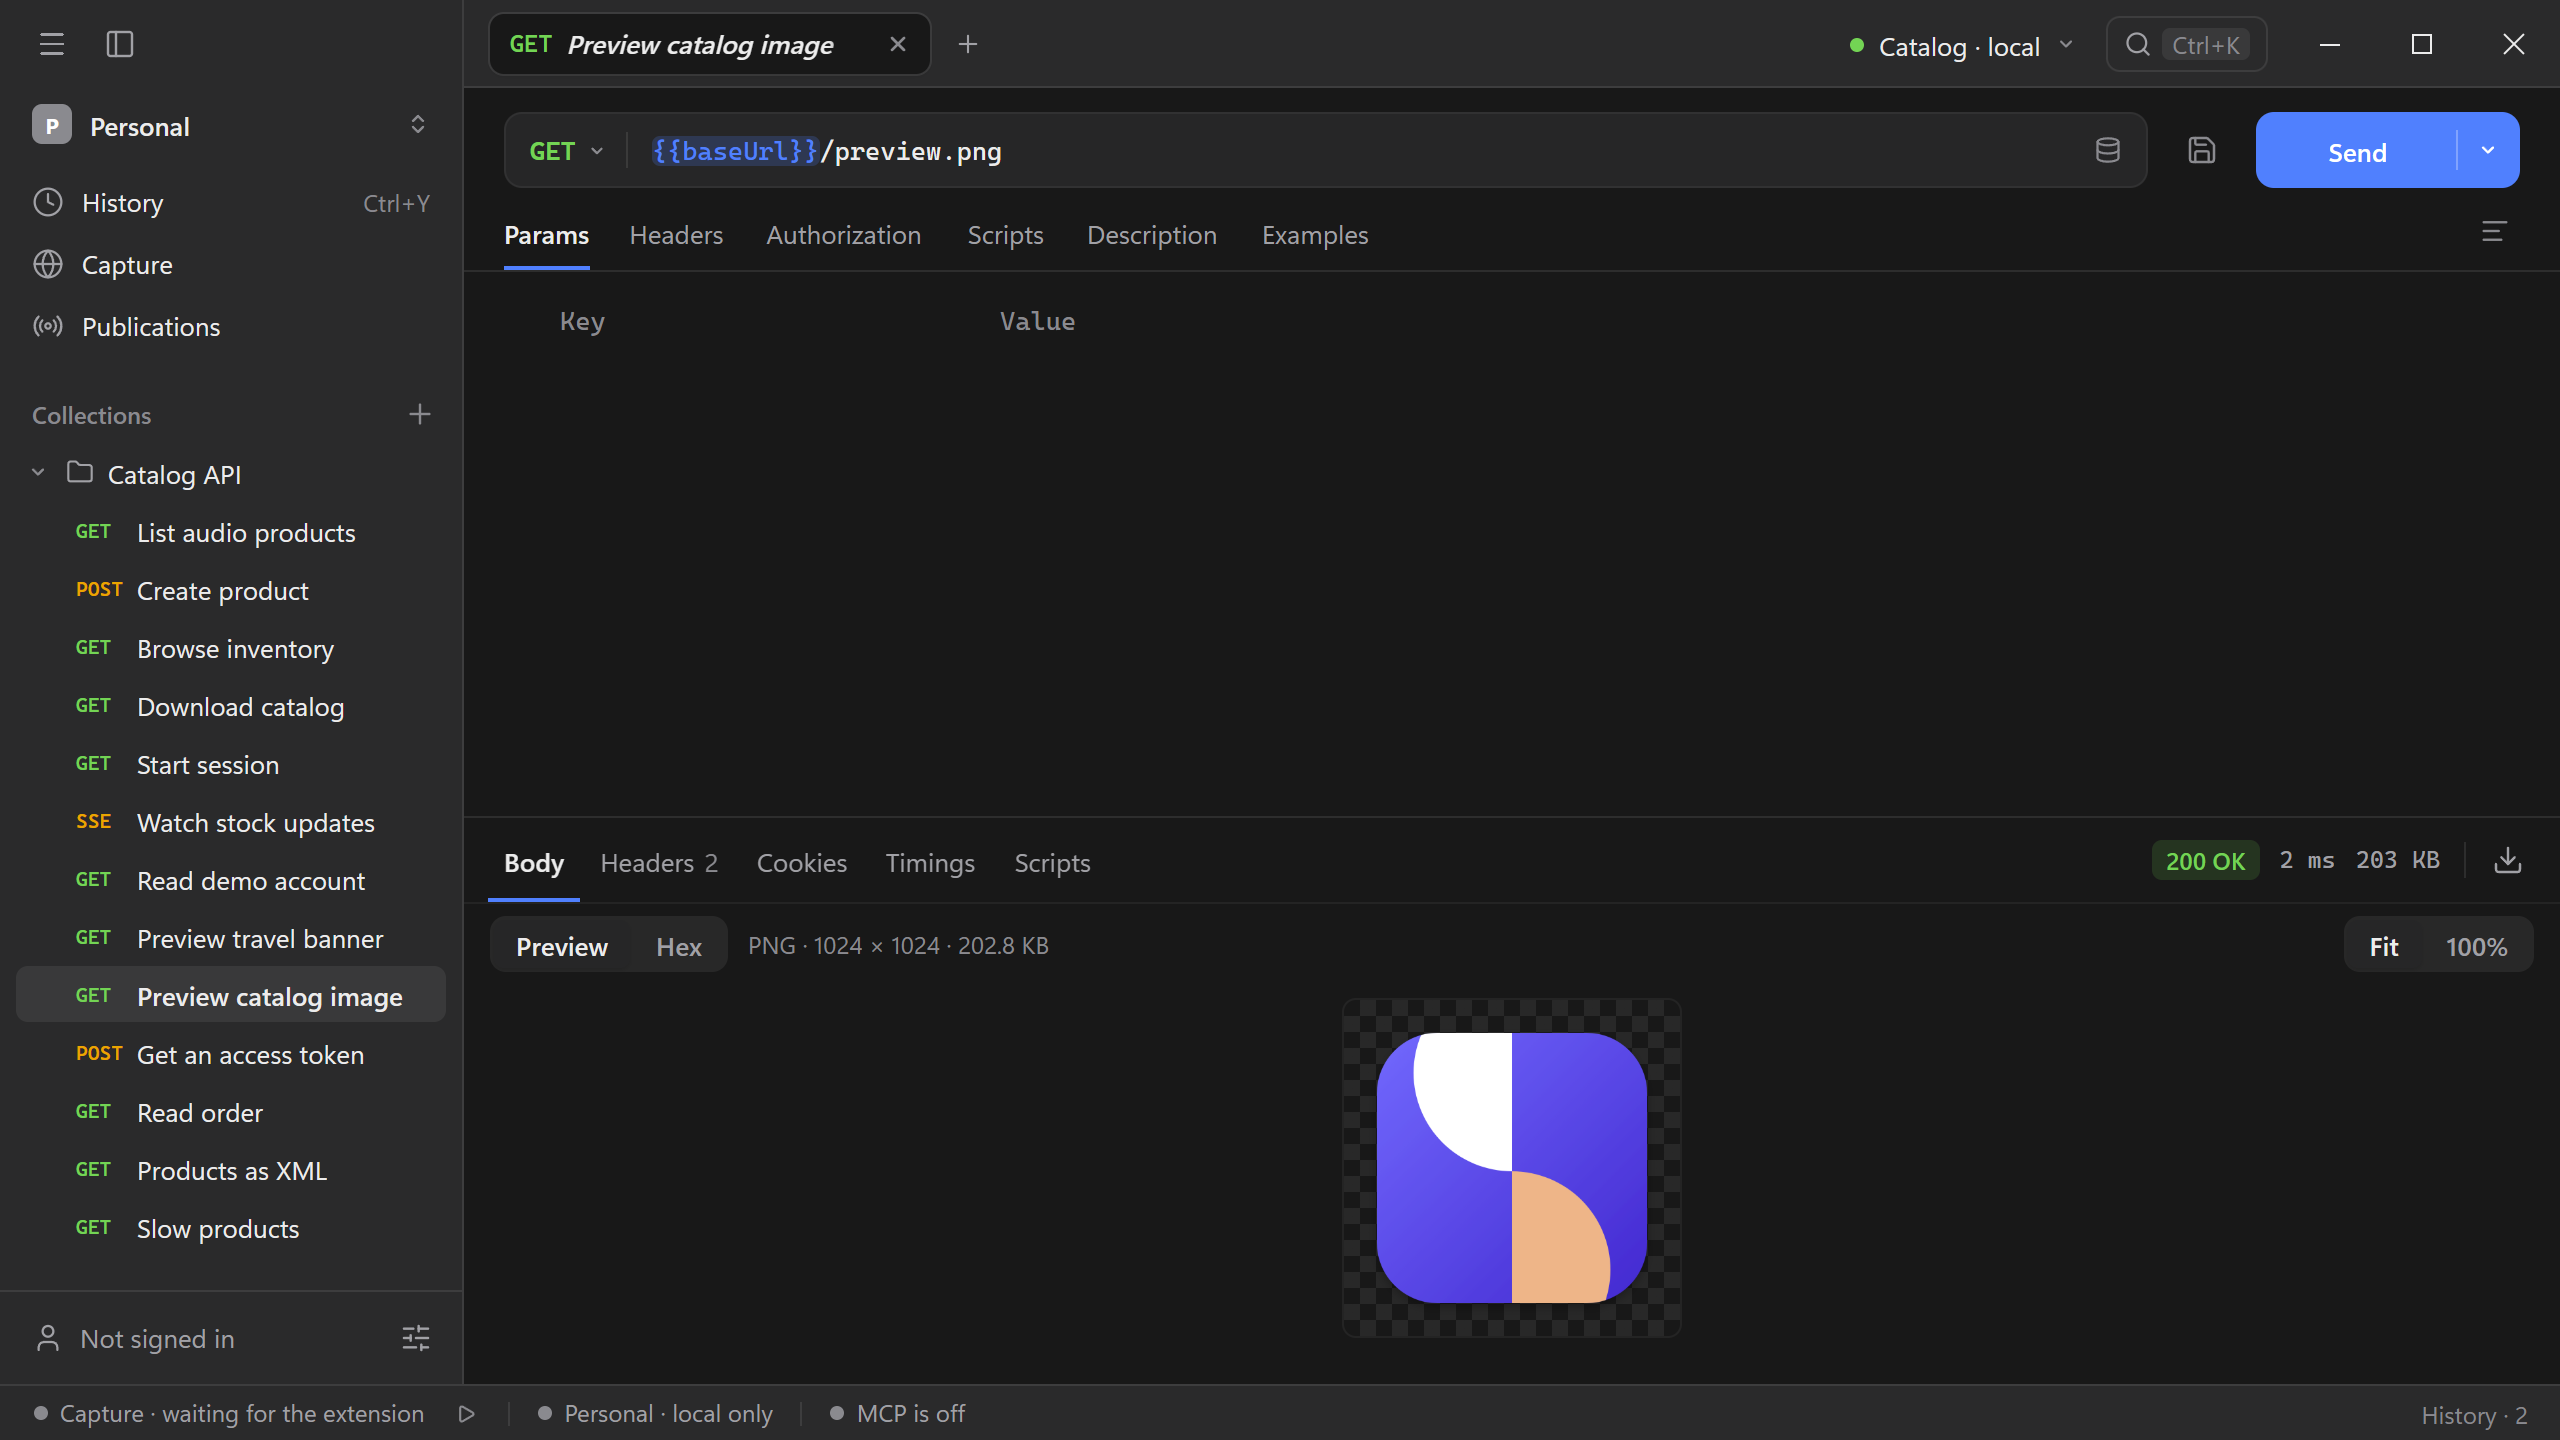
- Images and videos support Preview and Hex. Select the image or use Fit and 100% to switch scale. PNG, WebP, and GIF previews use a checkerboard behind the image to show transparency.
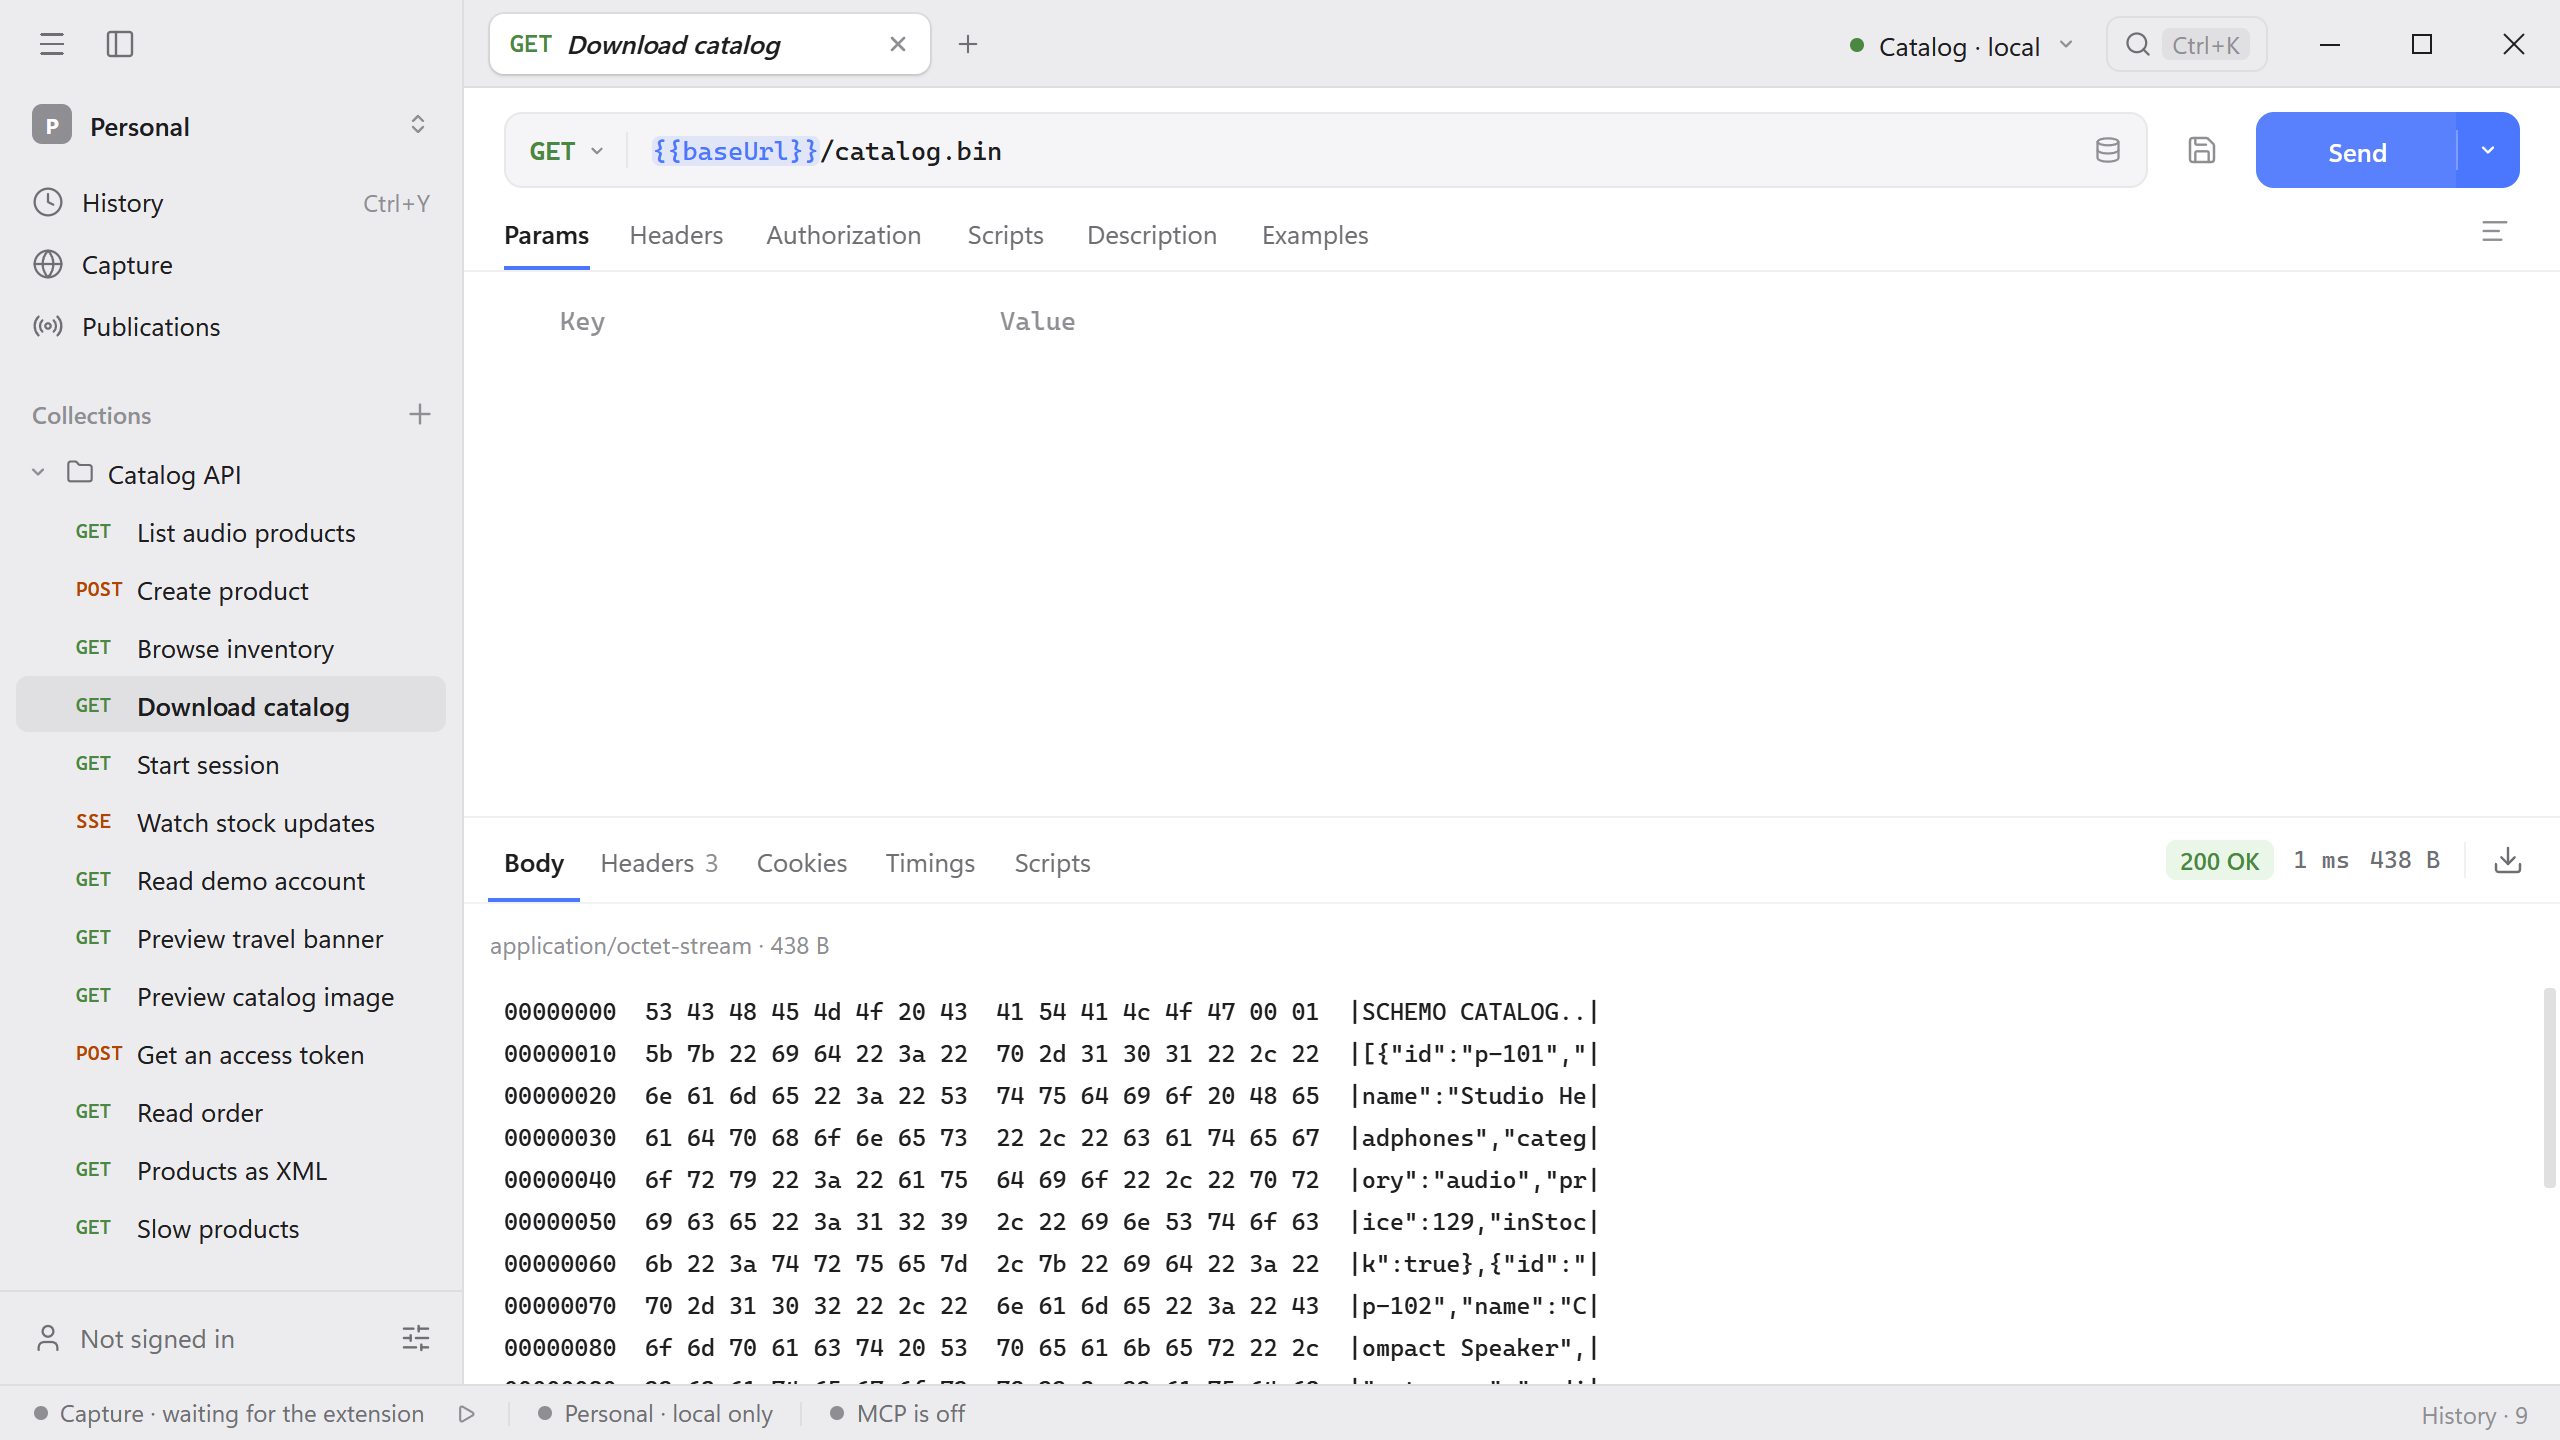
- Other binary responses open in Hex, which shows up to the first 256 bytes.
- Select the download icon in the response tab row to save the body to a file.
Try GET http://127.0.0.1:8787/preview.png from the Catalog API.
Try GET http://127.0.0.1:8787/catalog.bin from the Catalog API. The first line contains the SCHEMO CATALOG marker. The left column is the byte offset, the center shows hex values, and the right shows the printable characters. The footer gives the preview length and total response size.
Save an example
Save the request to a collection first. On a supported response, use To examples to keep that response with the request. See Descriptions and response examples for the full workflow. Use History to find a past execution.