
Interface
Find your way around the Schemo window, from the sidebar and tabs to the response pane and status bar.
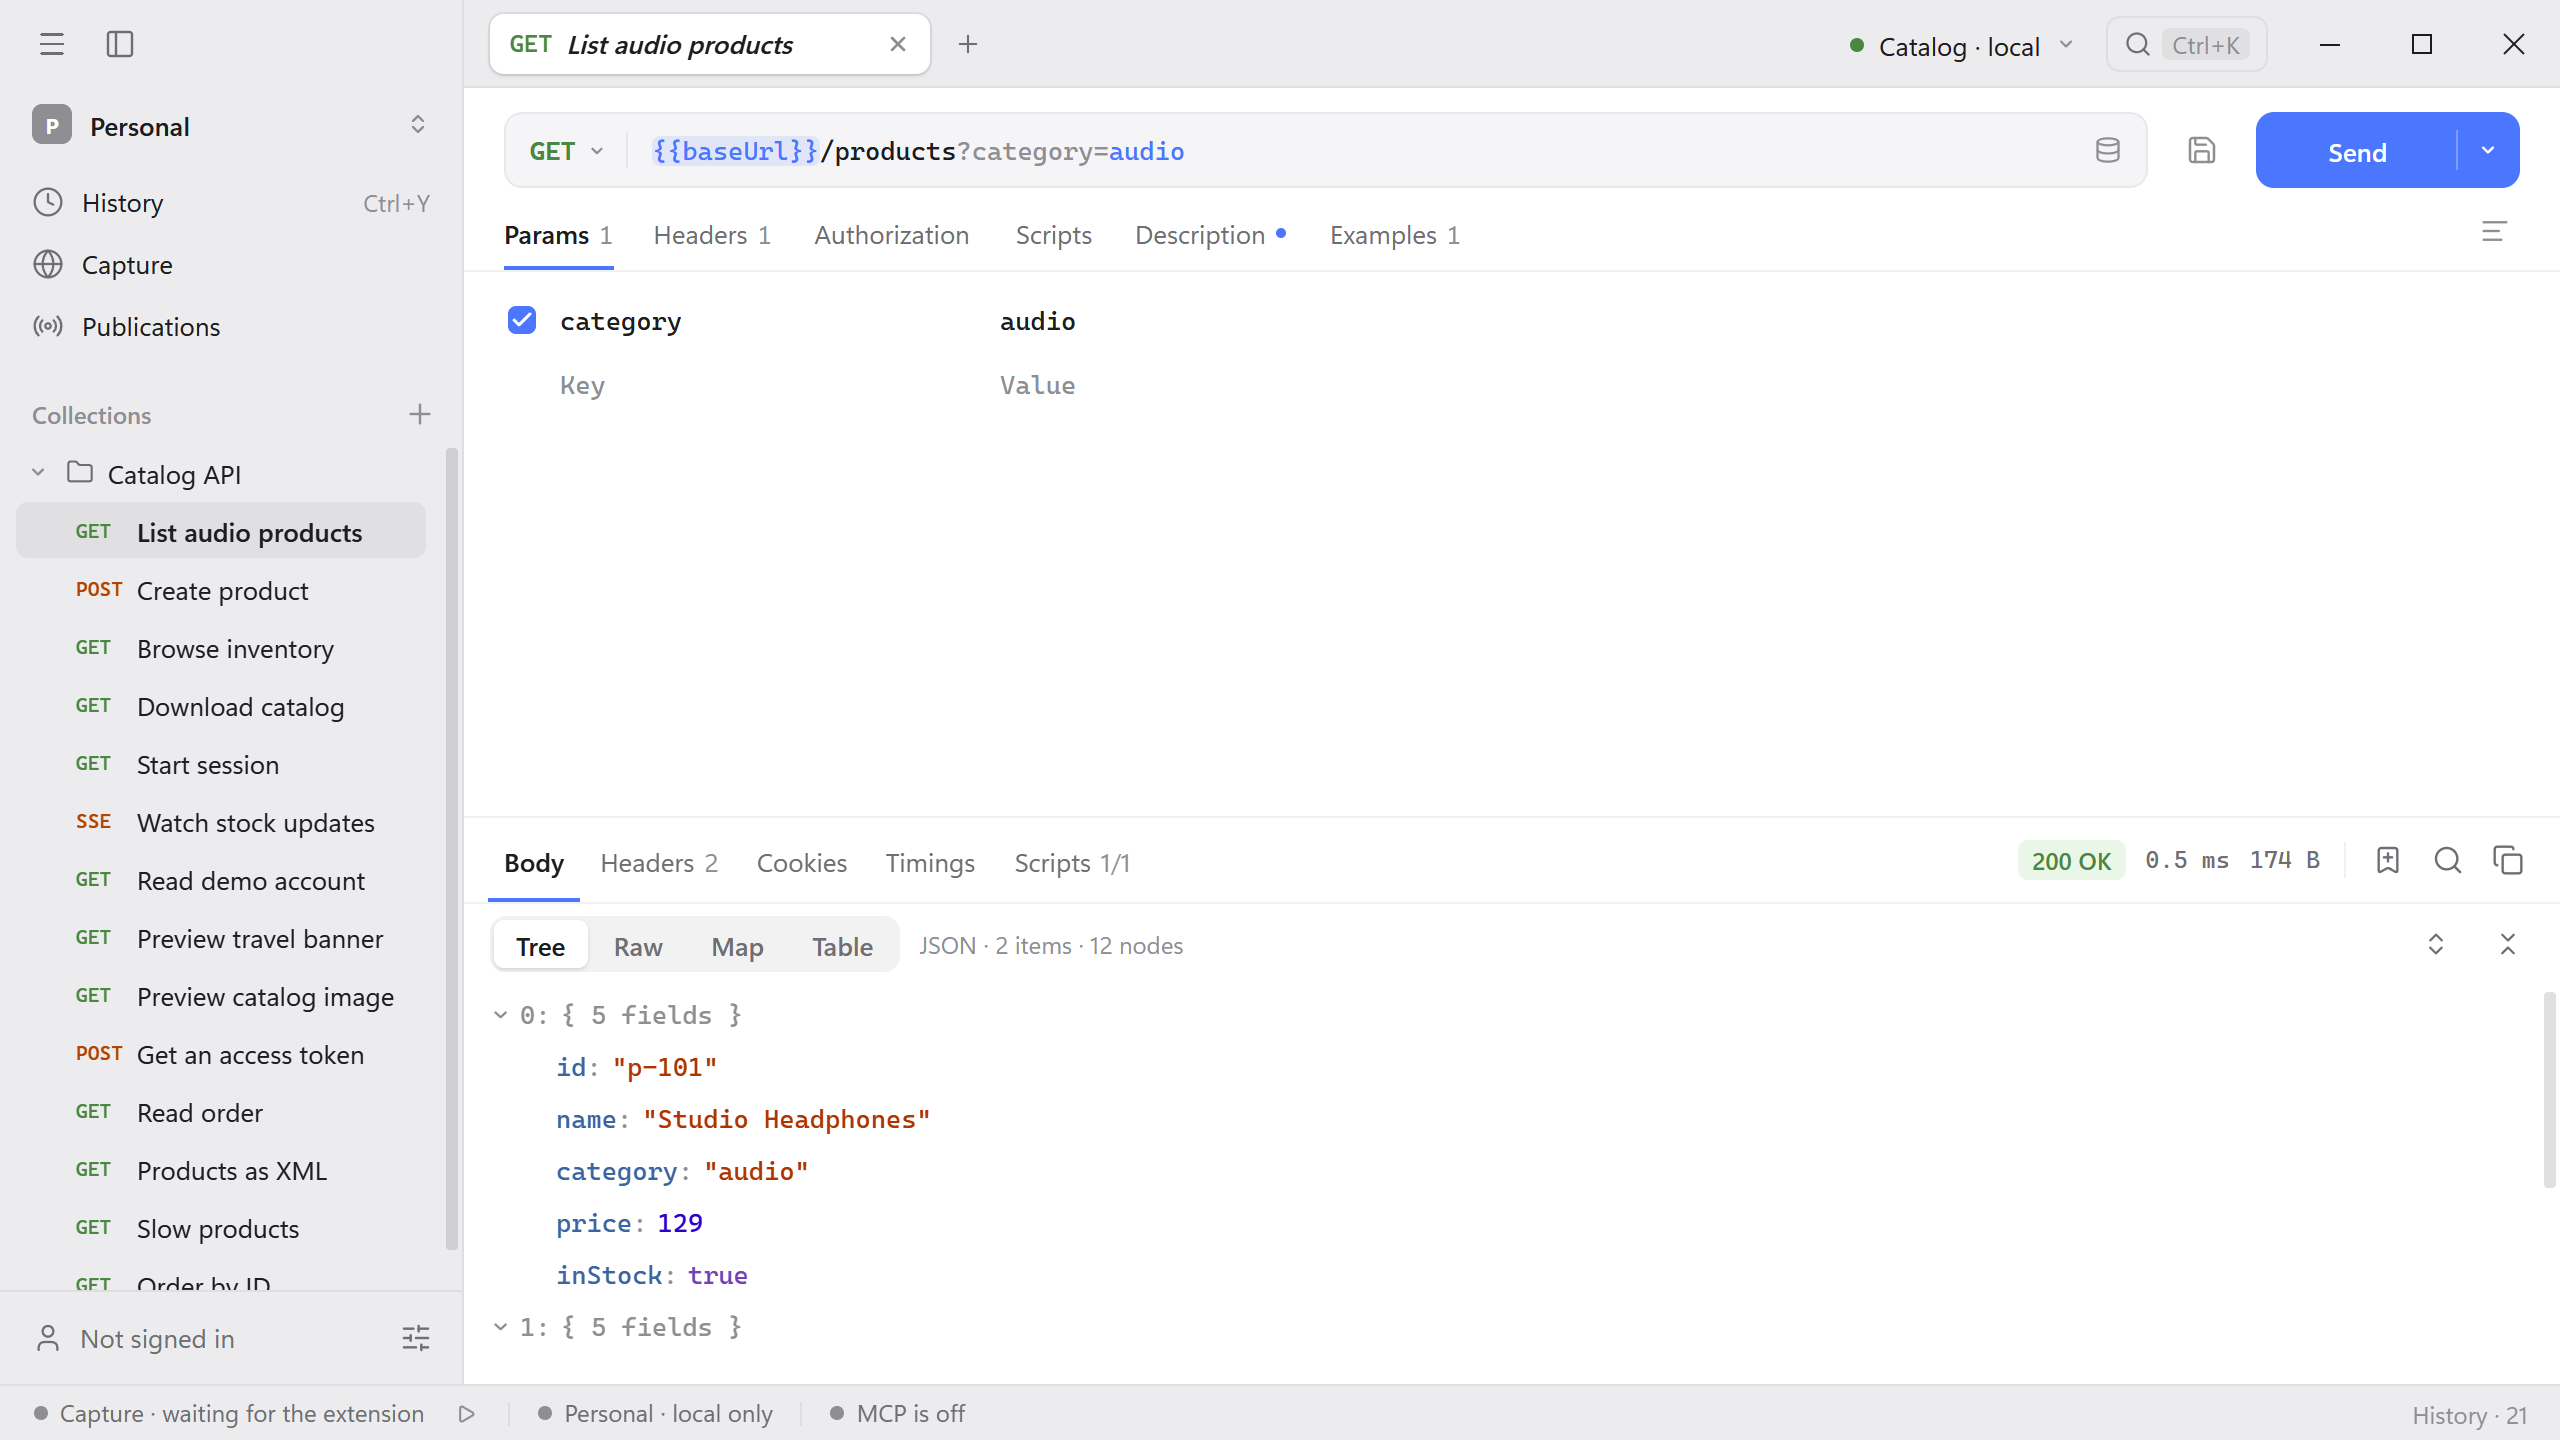
The Schemo window has five parts: the sidebar on the left, the tab strip along the top, the request editor, the response pane below it, and the status bar at the bottom.
Sidebar
| Item | What it does |
|---|---|
| Menu icon | Opens the app menu: File, Edit, View, Go, and Help. |
| Sidebar icon | Hides the sidebar, or press Cmd/Ctrl + B. Drag the sidebar’s edge to resize it; double-click the edge to reset its width. |
| Workspace name | Switches between workspaces and creates new ones. |
| History | Every request you sent. See History. |
| Capture | Requests recorded from the browser by Schemo Bridge. |
| Publications | Collections you published with Schemo Cloud. |
| Collections | Saved requests grouped into collections and folders. Use + to create a collection. |
| Account | Signs in to Schemo Cloud. The icon beside it opens Settings. |
Tabs and title bar
Each request, collection, and page opens in a tab. Opening something new replaces the tab in preview, shown in italics; edit it or double-click the tab to keep it. See Request tabs and the command palette.
On the right of the title bar are the current environment and the search field. Select the search field or press Cmd/Ctrl + K to find a request, collection, environment, history entry, or command.
Request editor
The address bar holds the method, the URL, and Send. The arrow beside Send copies the request as code. The save icon writes the request to a collection, or press Cmd/Ctrl + S.
The tabs under the address bar depend on the protocol. For HTTP they are Params, Headers, Authorization, Body (on methods that carry one), and Scripts. A saved request also has Description and Examples. A number on a tab shows how many rows it holds. Drag the border between the editor and the response pane to resize them; double-click it for an equal split.
Response pane
The status, duration, and size appear on the right of the response tabs. The icons beside them keep the response as an example, search the body, and copy it. The tabs are Body, Headers, Cookies, Timings, and Scripts. See Response inspector.
Status bar
| Item | Select it to |
|---|---|
| Capture | Open captured requests. While Schemo Bridge is connected, it shows how many tabs are recorded, and the button beside it pauses or resumes recording. |
| Workspace | Manage workspaces. It shows whether the workspace is local only or synced. |
| MCP | Open the MCP settings. It shows whether the server is on and how many agents are connected. |
| History | The number of records the workspace keeps. |
When an update is ready, the status bar also shows the new version. Select it to install the update.