
Find where a slow request spent its time
Use History and Timings to tell connection setup, server wait, and download apart.
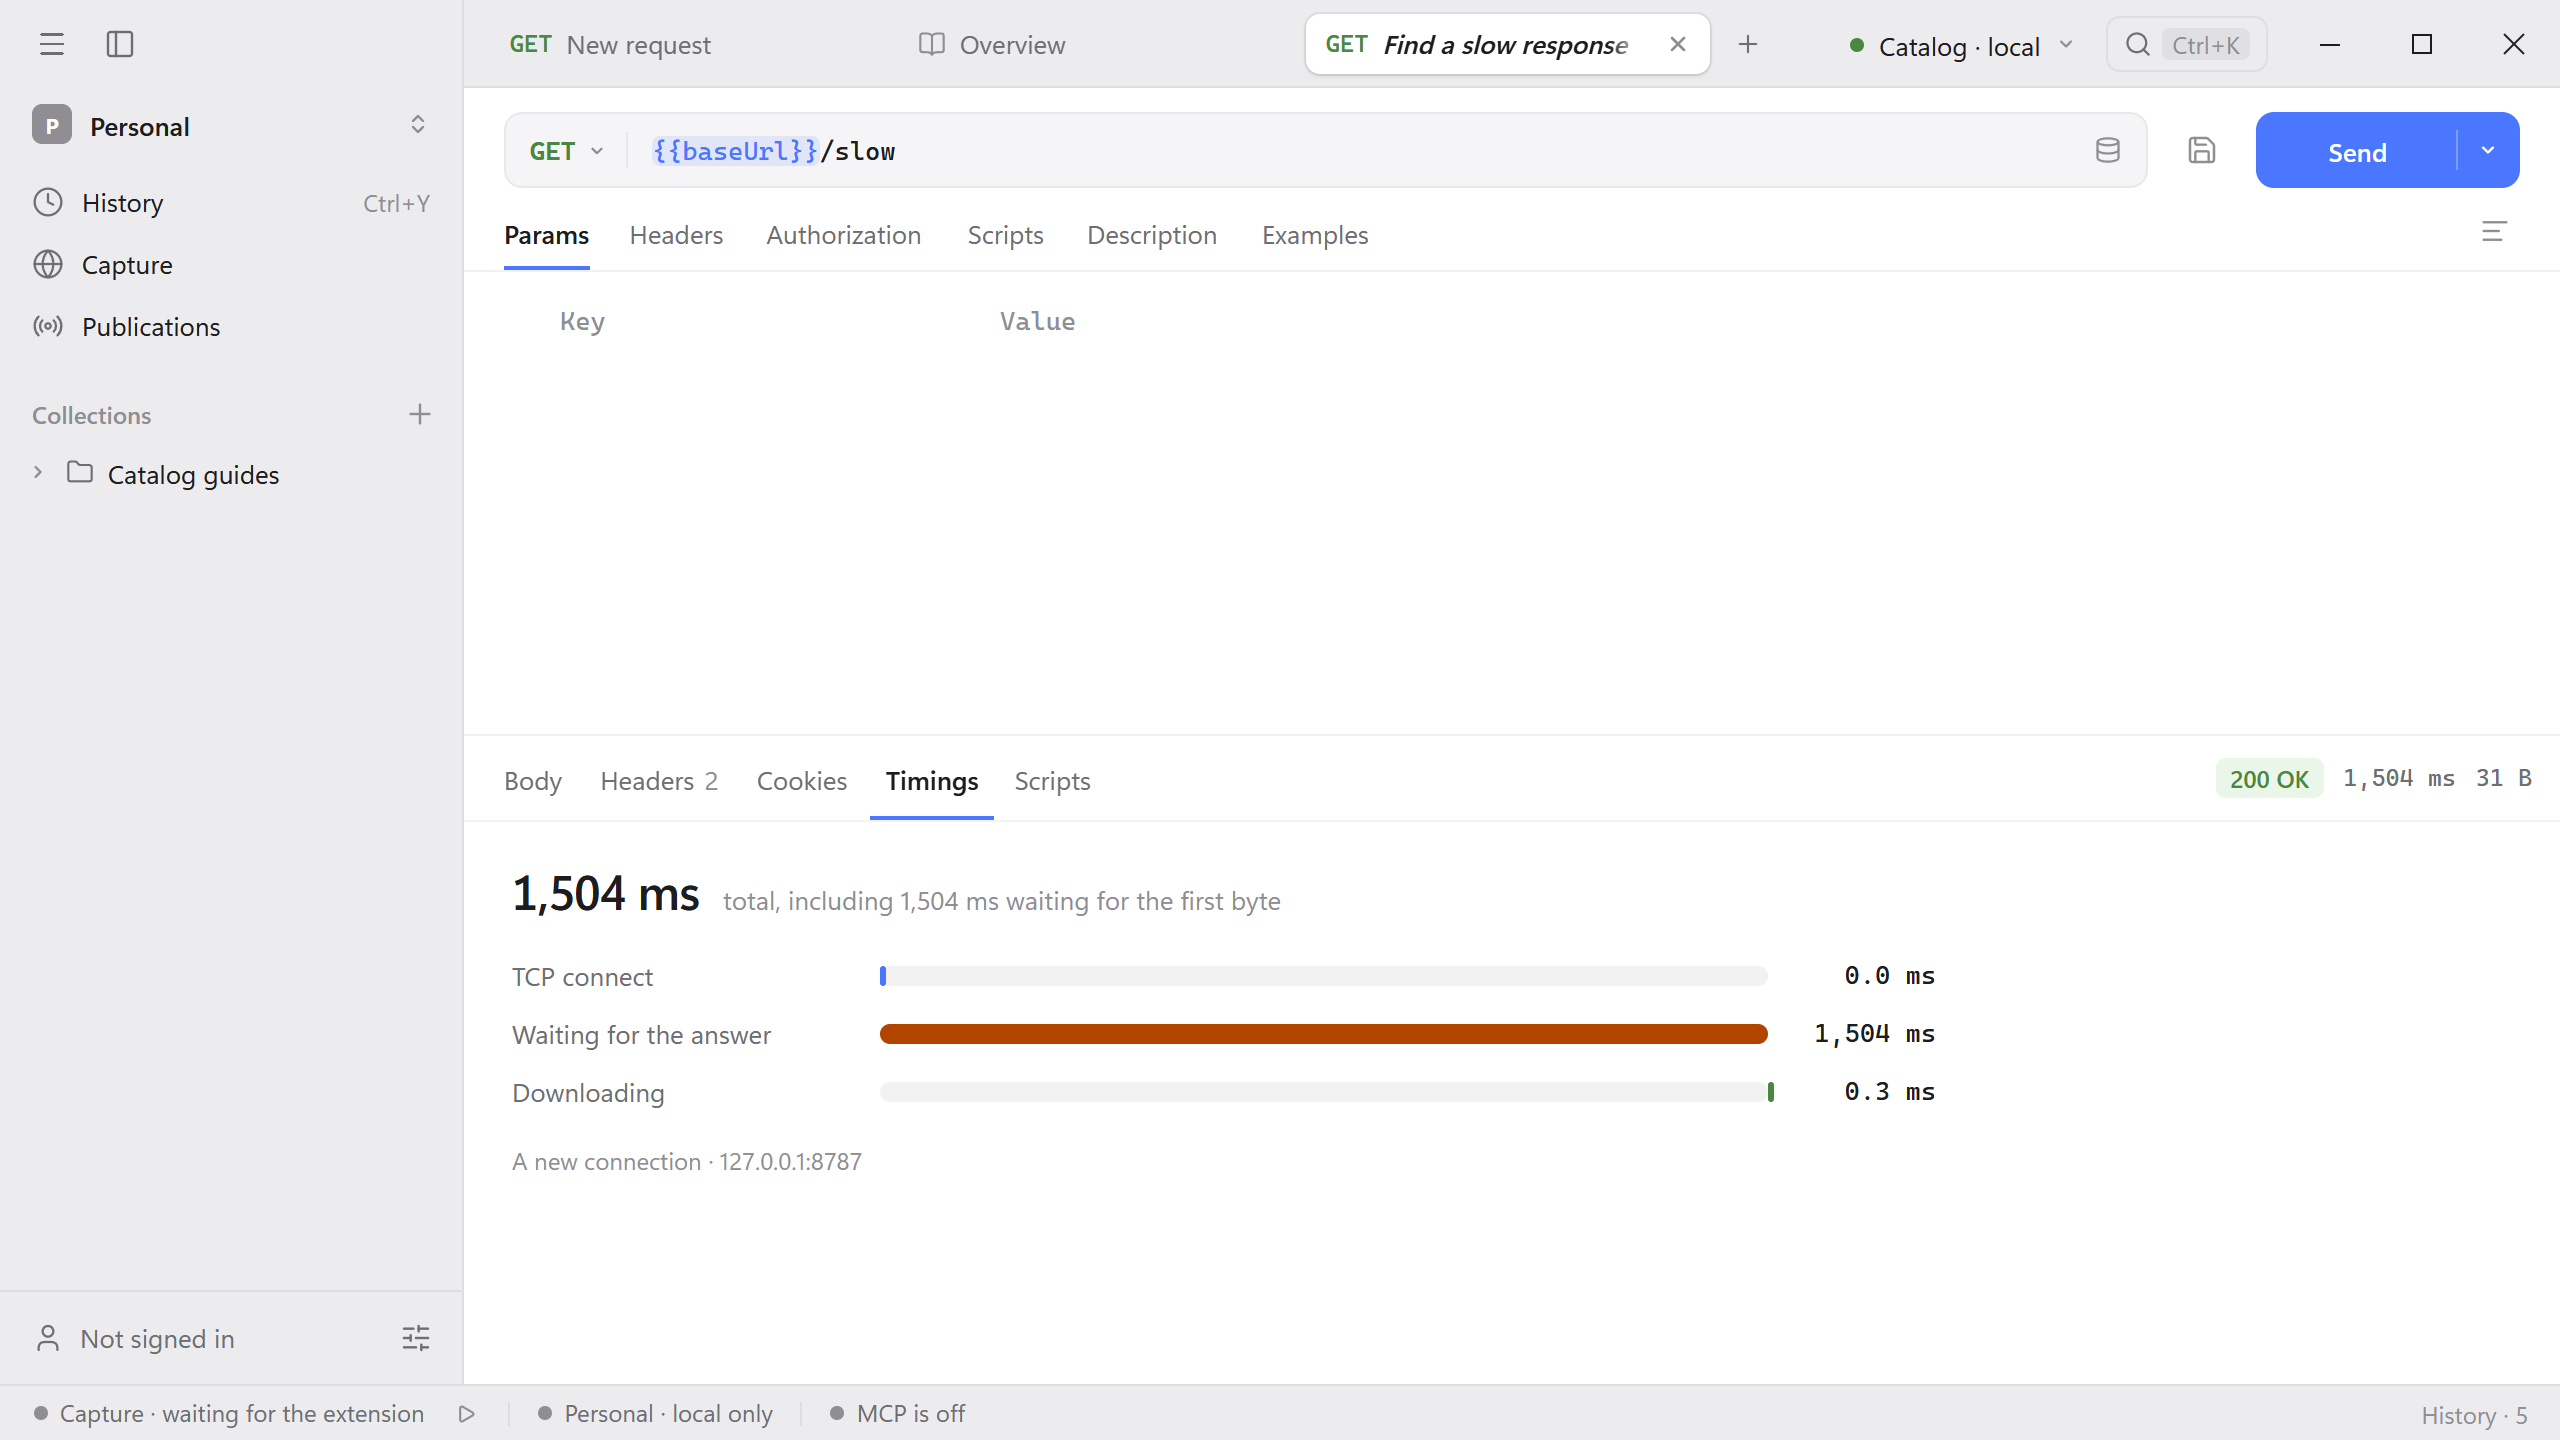
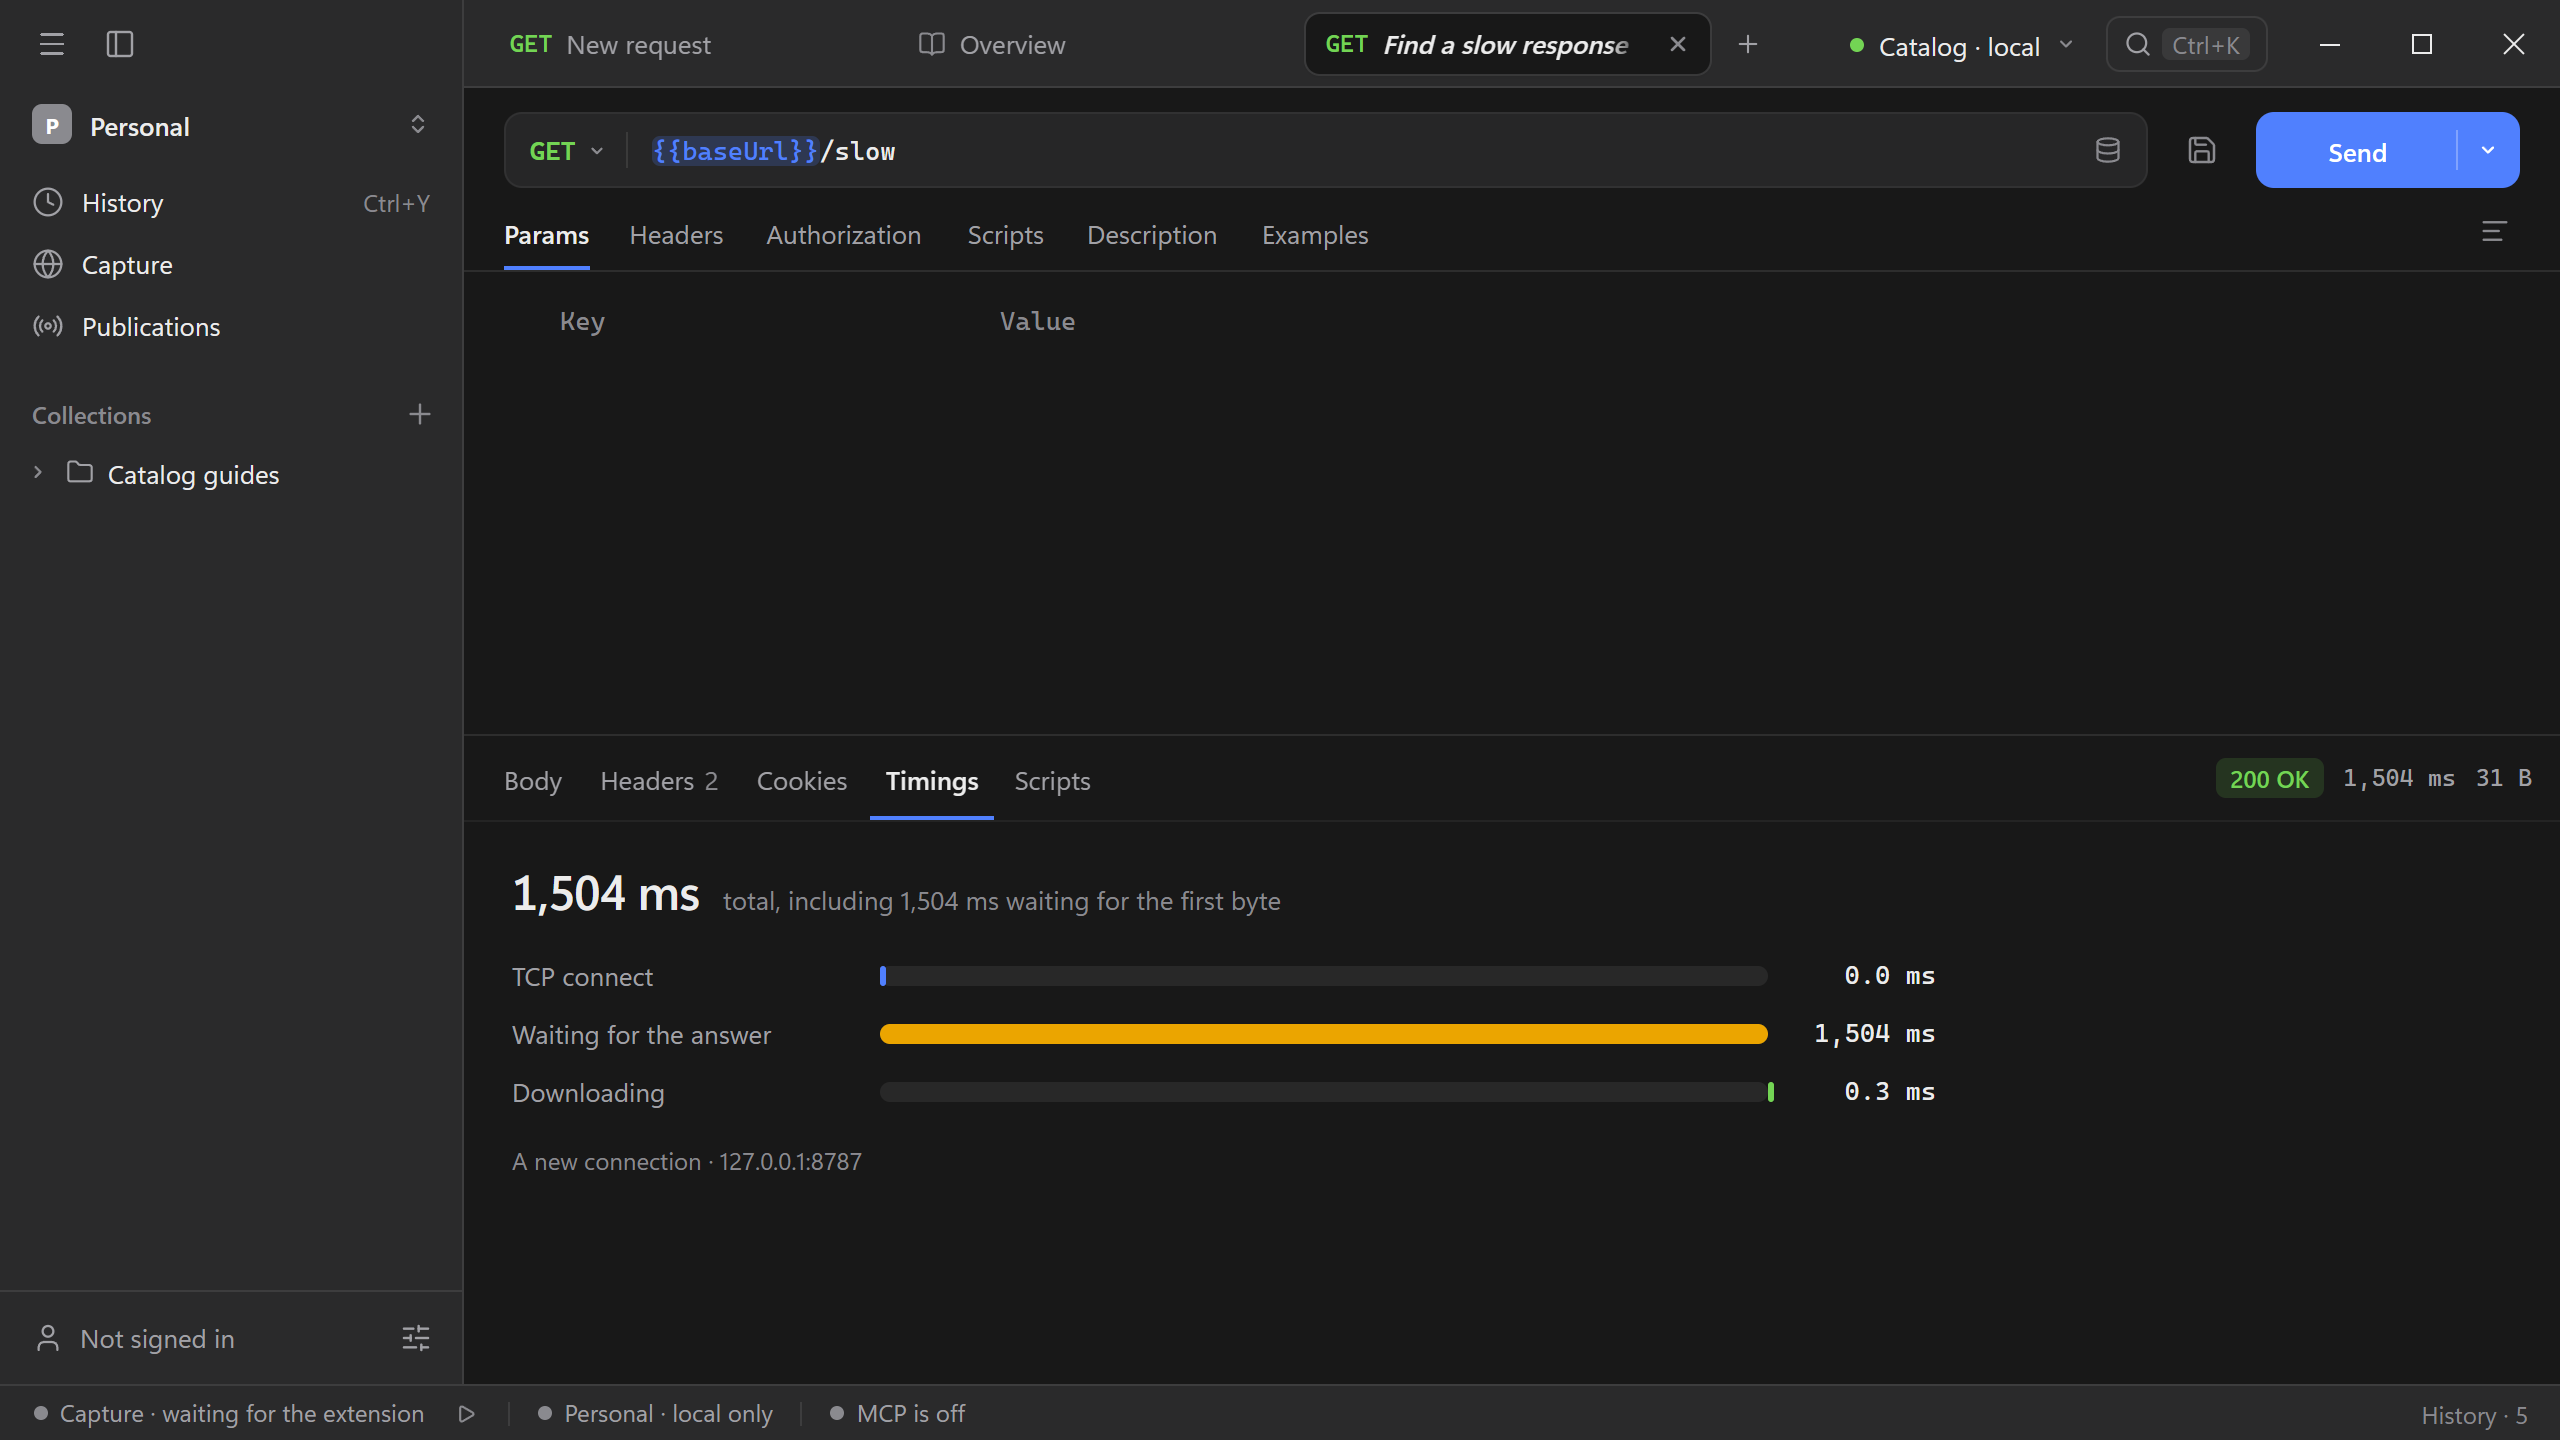
A duration tells you a request was slow. The Timings tab shows which phase used the time, and History gives you the same measurements for earlier runs.
Send a slow request
- Start the Catalog API and send
GET {{baseUrl}}/slow. - Open Timings in the response. The demo waits about 1.5 seconds before sending its first byte. Most of that time appears under Waiting for the answer.
- Send
GET {{baseUrl}}/productsfor a quick comparison against the same server.
Find it again
Open History with Cmd/Ctrl + Y and select Slow. Open the /slow record and review its original timings. The connection note tells you whether a connection was reused. Check that note when comparing DNS, TCP, or TLS time between sends.